
Pharos documentation v1.0.0
Pharos documentation
Reference for Pharos 1.0.0. Start with the installation guides and searchable documentation. This complete reference keeps existing section links working.
What Pharos is
Pharos is a self-hosted status page that runs its own checks. It polls HTTP endpoints, TCP ports and DNS records, watches certificate expiry, listens for heartbeats from jobs it cannot see from outside, and sets component status without anyone pressing a button. A failing check opens an incident and posts the first update; a recovered check closes it and posts the closing update. It speaks the Cachet 2.x API shape on purpose, so scripts written against Cachet keep reading it unchanged.
| PHP | 8.3 or newer |
|---|---|
| Database | SQLite (default) or MySQL |
| Extensions | pdo_sqlite (plus pdo_mysql for MySQL), mbstring, openssl, sodium, zip, curl, fileinfo, tokenizer, xml, ctype, json. The installers check every one before writing anything. HTTP checks need allow_url_fopen on. |
| Web server | Serve only the public files. The web installer copies them into the existing document root; SSH/manual installs point the root at public/. Apache needs mod_rewrite; nginx needs equivalent routing. |
| Runs on | A compatible host with PHP 8.3+, required extensions, writable storage, outbound HTTPS and cron (cPanel, DirectAdmin, Plesk or a plain VPS), or Docker |
A health endpoint is available at /up.
Install on cPanel, DirectAdmin, Plesk or compatible PHP hosting
Three ways in, one result: the application lives outside the web root, only its public files are served by the web server, and one cron line runs every minute. Pick the way that fits your host: no SSH, SSH, or by hand. Prefer containers? Skip to Docker. Every path downloads the same signed release: the installer verifies the Ed25519 manifest and the SHA-256 before it unpacks a single file.
Plesk is documented, not verified. cPanel and DirectAdmin are verified on live hosts. The Plesk steps on this page are written down, but they have not been run on a live Plesk server yet. Try them on a test domain first, and see the Plesk procedure below.
A. Without SSH: the web installer (cPanel, DirectAdmin, Plesk)
One PHP file you upload next to your site. It checks the server, downloads the signed release, verifies it, sets up the database and shows the one cron line, then removes itself. It walks through seven steps: Unlock, Check the server, Download, Configure, Scheduler, and then Your account and Done inside Pharos. Each step also works without JavaScript; with it, long steps show live progress.
- Download pharos-install.php and upload it into the document root of the domain you want the status page on: File Manager, then
public_htmlor the subdomain's folder. - Unlock. Open
https://status.example.com/pharos-install.phpand unlock it with the private installation key from the file shown on screen, using your hosting File Manager. Keep this key for the account step. - Check the server. PHP 8.3+, extensions, writable folders and access to the release server, grouped with a fix for cPanel, DirectAdmin and Plesk where something is missing. Nothing is written yet.
- Download fetches the release, checks the signed manifest and the checksum, unpacks the application into a private
pharos-app-<domain-id>folder next to the web root, never inside it, and copiespublic/into the document root with anindex.phpthat points at the app. No document root change is needed, and.envis never reachable from the web. - Configure asks for the site address, detected from the page, and the database: SQLite is recommended and needs nothing from your host; MySQL or MariaDB has a Test connection button. Save settings and set up the database writes
.envwith a fresh key and runs the migrations. - Scheduler shows the one line with the right PHP binary for your host. Add it under Cron Jobs (cPanel, DirectAdmin) or Scheduled Tasks (Plesk); the screen turns green by itself on the first run. It also shows your installation key once more, with a Copy button. Continue to your account deletes the installer file and opens step 6 in Pharos.
- Your account and Done happen in Pharos. Step 6: paste the installation key, name the status page, pick the time zone and create your administrator with Create my account and finish. Step 7 shows the version, address, database and scheduler state, and opens Pharos.
The installer keeps whatever your panel already put in .htaccess (PHP handler, ini blocks) and adds Pharos's rules underneath, including DirectoryIndex index.php so a placeholder index.html from the panel does not shadow the page. A half-finished install resumes where it stopped; a finished one refuses to run twice.


pharos-app-<domain-id> folder, public/ into the web folder.

B. With SSH: one command
curl -fsSL https://pharos.solutionmax.net/get | sh -s -- --php --url https://status.example.com
The script reads the machine (PHP version and extensions), verifies the manifest and the archive, unpacks into a private pharos-app-<domain-id> folder (change it with --dir), writes .env, migrates, links storage and adds the cron line to your crontab with the PHP binary pinned to the version it found. Where it cannot write the crontab (DirectAdmin's jailed shell, for one), it prints the line for you to add in the panel. Read it first if you like: curl -fsSL https://pharos.solutionmax.net/get | less.
Then point the document root at ~/pharos-app/public. Unlike the web installer, the script does not touch your web folder. This is the one step it leaves to you:
- cPanel: Domains → Manage → Document Root. Over SSH, for a subdomain:
uapi SubDomain changedocroot domain=status.example.com docroot=pharos-app/public. - DirectAdmin: Domain Setup if your host lets you set a document root. Most do not for user accounts; then replace the web folder with a link, which DirectAdmin's Apache follows:
cd ~/domains/status.example.com && mv public_html public_html.orig && ln -s ~/pharos-app/public public_html - Plesk: Hosting Settings → Document root →
pharos-app/public. - Your own server: an nginx or Apache vhost with its root at
/home/you/pharos-app/public, PHP-FPM 8.3, and every unknown path rewritten toindex.php; the.htaccessinpublic/does that on Apache.
Apache and LiteSpeed pick the new root up within a minute. Open the site: the setup form appears. Never set the document root to a private pharos-app-<domain-id> folder itself: that exposes your .env.
Updating is the same command again: the script hands over to Pharos's own updater, which backs the current version up first. The Updates screen in the admin does the same with a button.


Installing a specific version
Both installers take the newest release from /releases/latest.json unless you pin one, to reproduce something, or to walk through an update yourself:
curl -fsSL https://pharos.solutionmax.net/get | sh -s -- --php --url https://status.example.com --version 1.0.0
https://status.example.com/pharos-install.php?version=1.0.0
A pinned install reads pharos-<version>.json, the manifest signed for that exact release; a version that was never published fails cleanly. Each release on the releases page also carries its own pre-pinned copy of the web installer, pharos-install-<version>.php, for when a query string is awkward. Afterwards the Updates screen offers the newest release as usual. Pharos never downgrades on its own: to go back, use Roll back under Updates, restore a verified backup. The get --version option is for new installations and refuses to overwrite an existing PHP install.
C. By hand
If you would rather not run either installer, it is a standard PHP 8.3 application:
git clone https://github.com/solutionmax/pharos.git ~/pharos && cd ~/pharos
composer install --no-dev --optimize-autoloader
cp .env.example .env && php artisan key:generate
touch database/database.sqlite && chmod -R 775 storage bootstrap/cache database
php artisan migrate --force && php artisan storage:link
php artisan config:cache && php artisan route:cache && php artisan view:cache
Set at least APP_ENV=production, APP_DEBUG=false, APP_URL and DB_CONNECTION=sqlite in .env, point the document root at ~/pharos/public as in B, and add the cron line below. Run php artisan optimize:clear after any .env change.
SQLite needs a writable directory, not just a writable file. It writes its journal next to the database, so permissions on the folder matter as much as on the file itself.
The first browser visit shows the setup form. From the command line instead: php artisan pharos:user you@example.com --name="Your Name" prints a generated password once, updates an existing account rather than failing, and is also how you get back in if you lock yourself out.
Plesk: the documented procedure
This is the procedure for Plesk as it is written down for 1.0. It has not been verified on a live Plesk server, so read it as steps to test, not as a tested route.
- Select PHP 8.3 or later for the domain. Enable cURL, mbstring, OpenSSL, sodium, PDO SQLite (or PDO MySQL), XML and DOM, fileinfo, GD and ZIP.
- Unpack the release zip from the releases page into
pharos-app/under the site's own system user, then set Hosting Settings → Document root topharos-app/public. - Copy
.env.exampleto.env. Set the HTTPS address of the site, APP_DEBUG=false and the database. Then run, as that site's user:php artisan key:generate --force php artisan migrate --force php artisan storage:link
- Give that user write access to
storage/andbootstrap/cache/. Do not use world writable permissions. Nothing outsidepublic/may be reachable from a browser: not.env, notvendor/, not the database. - Add a Scheduled Task that runs every minute as the site user:
/opt/plesk/php/8.3/bin/php /var/www/vhosts/example.com/pharos-app/artisan schedule:run
- Finish the account setup in the browser. Then prove the basics on that host: an HTTP check, a confirmation mail that arrives, a maintenance window, a backup, an update and a rollback. Check that the scheduler's last run is current.
The documented rollback is the same as on other PHP hosts: restore the files and the database that belong together. See Updates. It has not been verified on a live Plesk server either.
The one cron line
Everything time-based hangs off one scheduled command. Both installers give you the exact line; by hand, add a job that runs every minute (cPanel Cron Jobs, DirectAdmin Cron Jobs, Plesk Scheduled Tasks). In the panel's form the five stars go in the time fields and the rest in the command field:
* * * * * cd /home/you/pharos-app && php artisan schedule:run >/dev/null 2>&1
If your host's default php is not 8.3, use the full path to the 8.3 binary. cPanel exposes it as /opt/cpanel/ea-php83/root/usr/bin/php or /opt/alt/php83/usr/bin/php, and DirectAdmin as /usr/local/php83/bin/php. The documented path for Plesk is /opt/plesk/php/8.3/bin/php; like the rest of the Plesk steps it has not been verified on a live Plesk server. Pharos shows a warning in the admin until it sees the first run; verify by hand with php artisan pharos:check --force.
With SSH you do not have to type the line yourself. Run these from the application folder:
php artisan pharos:cron            # print the line for this install
php artisan pharos:cron --install  # add it to this user's crontab, other tasks stay
That one line drives everything Pharos does on a clock:
| When | What runs |
|---|---|
| Every minute | Due checks, uptime for services that are reported from outside, maintenance windows, subscriber mail, outgoing notifications, and the worker for a probe location when this install is one. |
| Daily, 02:45 UTC | Remote backups, when a destination is set. |
| Daily | Pruning: the audit log, raw check results, and probe results. |
No cron on your host at all? An outside service can call Pharos over HTTPS every minute. See Web cron. Real cron stays the better choice wherever you have it.
Install with Docker
The short way: curl -fsSL https://pharos.solutionmax.net/get | sh on a host with Docker (it offers to install Docker if it is missing) writes a compose file and a fresh APP_KEY, pulls the image and brings the two containers up. By hand: Two containers from the same image, ghcr.io/solutionmax/pharos (one tag per release plus :latest, linux/amd64 and linux/arm64): Apache with mod_php serving the app, and a second one
running the scheduler. They share the database and storage volumes.
git clone https://github.com/solutionmax/pharos.git && cd pharos
cp .env.docker.example .env
docker run --rm php:8.3-cli php -r "echo 'base64:'.base64_encode(random_bytes(32)).PHP_EOL;"
Paste that whole string, including the base64: prefix, into APP_KEY=.
Compose refuses to start without it. Then:
docker compose up -d
docker compose exec app php artisan pharos:user you@example.com --name="Your Name"
docker compose up -d pulls the tagged image, or builds it from the checkout when the registry image is not reachable.
Updating is docker compose pull && docker compose up -d. Inside a container Pharos does
not replace its own files: the Updates screen says the install is managed from the host and shows that
command. Pin a release with PHAROS_VERSION=1.0.0 in .env; docker compose up -d --build
builds the same image from the checkout when you would rather not pull it. The installer does the same on its own:
it pulls the image and only builds it from the signed release archive when the registry cannot be reached.
There is no separate migrate step. The entrypoint runs migrations on every container start, clears the caches and rebuilds them, and for SQLite fixes the database directory's ownership.
The scheduler container must stay up. If you scale it to zero, nothing is checked and every component freezes at whatever status it last had, which looks exactly like everything being fine.
First run
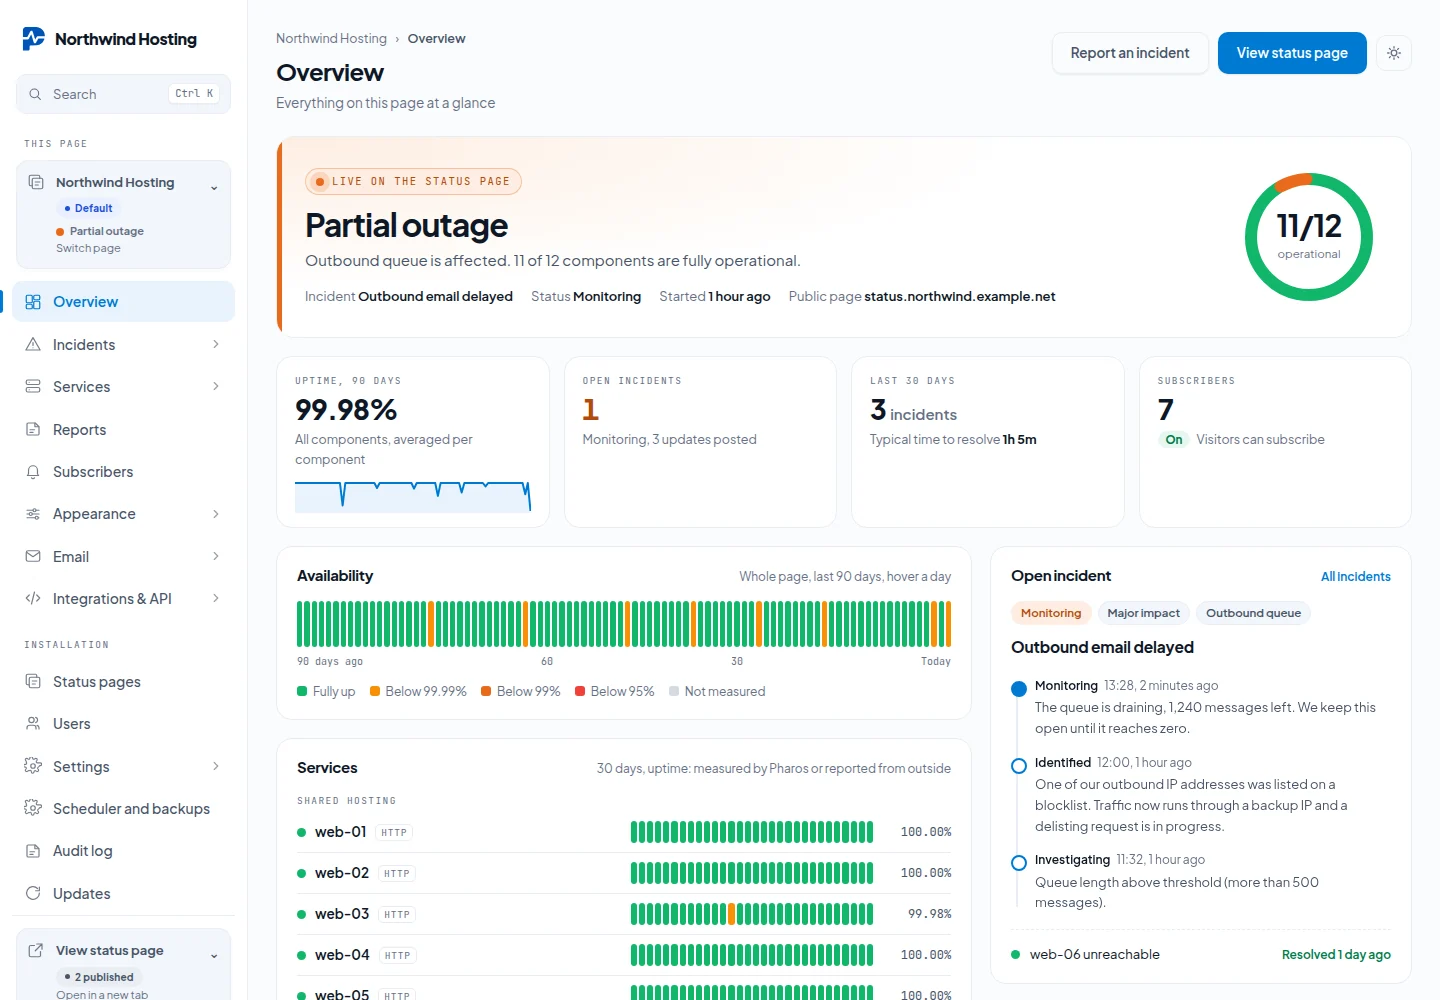
Sign in at /admin/login. You land on the Overview of your status page: what the public page says right now, the key figures, 90 days of availability, services and the open incident.
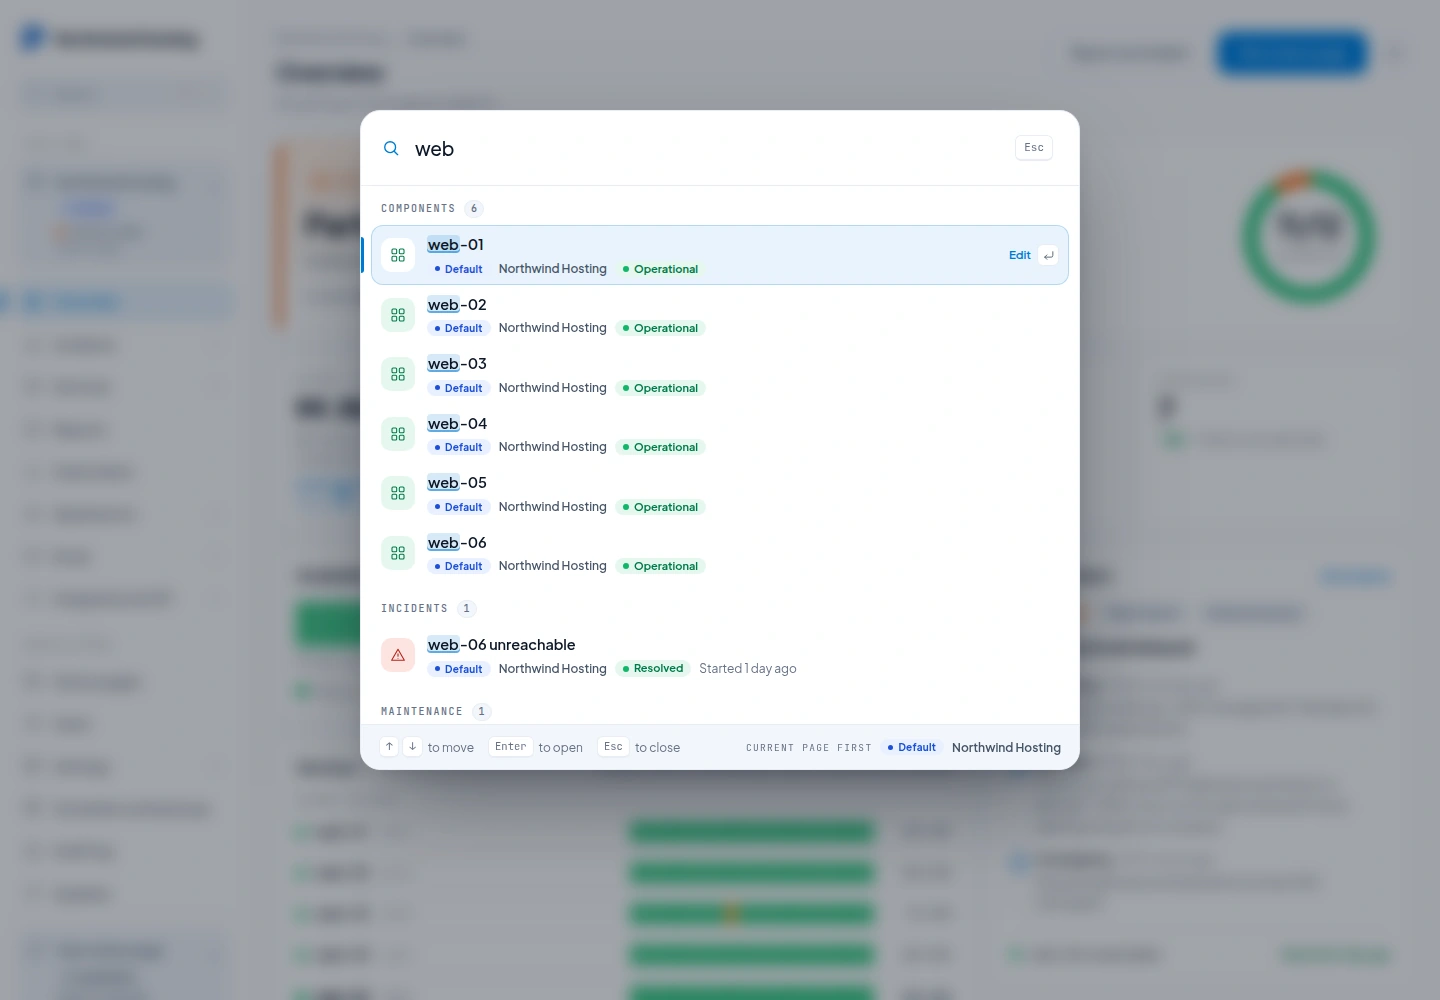
Press Ctrl K or Cmd K, or click Search in the sidebar, to jump to any page, service, component, incident, maintenance window or admin screen. Results are grouped, show their page and status, and only cover the pages you hold a role on.
Create services first, the headings your customers read, then put components inside them.
A component with no service is still published. It appears on the public page as a row of its own, without a heading, and it counts toward the headline uptime figure. Put components in a service when you want them grouped under a name your customers know.
Choosing a source
The Source field says who sets the status, and with that whether a check exists at all:
| Source | Who sets the status | Uptime |
|---|---|---|
| HTTP or TCP check | Pharos, with an HTTP, TCP or DNS check on your target and interval. | Measured by the check |
| Heartbeat from your job | Pharos, from a URL your job calls. The token is generated once and shown on the component. | Measured by the check |
| Uptime Kuma, API or webhook, Upstream provider | Something outside Pharos writes it through the API. There is no check. | Counted from the reported status |
| Manual only | You, in the admin. | Not measured |
You rarely have to pick the outside sources by hand. The first time the API or the Uptime Kuma endpoint writes a status for a component that has no enabled check, Pharos marks it as set from outside by itself. A status you set by hand in the admin changes nothing, and a component with its own check is left alone. See Uptime for how reported time is counted.
Hidden service versus disabled component
| Service hidden | Component disabled | |
|---|---|---|
| Shown to customers | No | No |
| Checks keep running | Yes | No |
| Counts toward the headline on the public page | No | No |
| History kept | Yes | Yes |
Hide a service to stop showing customers something you are still watching. Disable a component to stop watching it entirely while keeping its past.
How checks work
One command does all of it. The scheduler calls the plain form every minute;
--force is the diagnostic tool.
php artisan pharos:check          # only checks that are due
php artisan pharos:check --force  # every enabled check, with output
The four probe types
| Type | Target | Up when |
|---|---|---|
| HTTP | A full URL | The response code is 200 to 399 and, when you set one, the expected text is in the response. Redirects are not followed. TLS is verified. |
| TCP | host:port | The socket connects. |
| DNS | A record name | A record of the chosen type has the value you expect. |
| Heartbeat | A generated token | Something called in within two intervals. |
Expected text, DNS records and certificate expiry are covered under DNS, keyword and certificate checks. A check can also be run from other networks: see Probe locations. How long each run took is kept for the latency chart.
What turns a component red
A component goes to Major outage once consecutive_failures reaches the
check's retry count, two by default. One failure is never enough. The first healthy result
flips it straight back to operational.
With the defaults, an HTTP, TCP or DNS target is red about two minutes after it starts failing. A heartbeat takes roughly two intervals plus one more run, because silence has to last before it means anything.
Two situations set Degraded performance instead of red. An HTTPS check that still answers but whose certificate has 3 days or less left, and a check with probe locations that has too few fresh results to decide. Neither opens an incident.
What opens and closes an incident
Crossing the retry threshold opens an incident named {component} unreachable,
status Investigating, impact major, with one automatic update naming the probe error. A
grouping key stops a second incident being opened while one is already open, and it is what
powers the repeat-outage counter on the incidents list.
After three consecutive successful checks the incident closes itself and posts a closing update. Incidents you created by hand are never closed by a check.
Heartbeats
POST https://status.example.com/api/v1/heartbeat/hb_xxxxxxxxxxxxxxxxxxxxxxxx
No authentication header: the unguessable path is the credential, so a backup script needs no token. Call it only when the job actually succeeded:
# the status page hears about it only if restic exits 0
30 3 * * * restic backup /data && curl -fsS -m 10 -X POST \
  https://status.example.com/api/v1/heartbeat/hb_xxxxxxxx >/dev/null
Set the component's interval to the ping frequency. A job pinging every five minutes wants an interval of 300, which gives it a ten-minute grace period.
DNS, keyword and certificate checks
A check can do more than fetch a URL or open a port. An HTTP check can require a piece of text in the response, a DNS check compares a record with the value you expect, and every HTTPS check reads the expiry date of the certificate. You set all of it on the component: Services → Components, then Add a component or Edit, in the panel How it is checked.
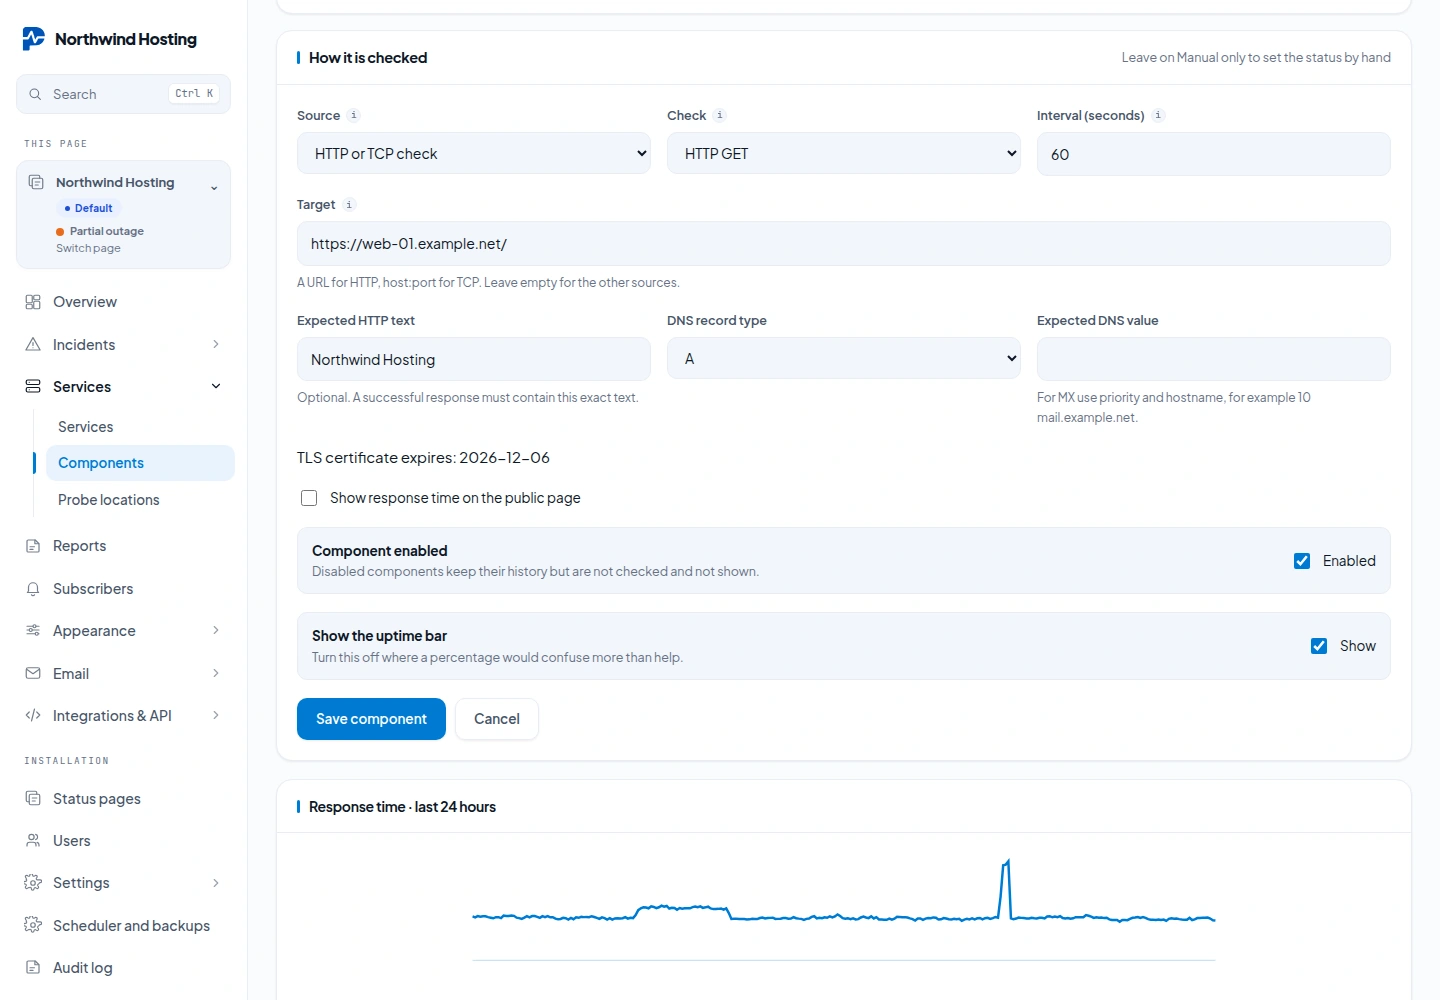
Set Source to HTTP or TCP check, then choose the kind under Check: HTTP GET, DNS record or TCP port.
| Field | Used by | What to enter |
|---|---|---|
| Target | All three | A full URL for HTTP, host:port for TCP, the record name for DNS, for example example.com. |
| Interval (seconds) | All three | How often to look: 30 to 86400, 60 by default. |
| Expected HTTP text | HTTP | Optional. Up to 1000 characters that the response must contain. |
| DNS record type | DNS | A, AAAA, CNAME, MX or TXT. |
| Expected DNS value | DNS | Required. The value one of the returned records must have. |
The rules for going red are the same for every kind: two failures in a row turn the component red and open an incident, three healthy runs in a row close it. See How checks work.
Keyword checks
Fill in Expected HTTP text to check that a page shows what it should, and not only that the server answers. The check is up when the response code is 200 to 399 and the response contains the text exactly as you typed it, upper and lower case included. When the text is missing the check fails with the message Expected text is missing.
- Redirects are not followed. Enter the address that serves the page itself, or Pharos looks for the text in the redirect response.
- An HTTP check reads at most 1 MiB of the response. A larger response fails the check, with or without expected text, so point it at a small page or a health endpoint.
- Pharos asks for an uncompressed response, so the text is compared with what the server actually sends.
DNS checks
A DNS check looks up one record and compares the answer. Enter the record name as the target, pick the record type and type the value you expect. The check is up when at least one of the returned records matches. The lookup is done by the resolver of the server Pharos runs on.
| Type | Expected value | How it is compared |
|---|---|---|
| A | 203.0.113.10 | As an address. |
| AAAA | 2001:db8::10 | As an address, so a shortened and a full notation of the same address match. |
| CNAME | web-01.example.com | Upper and lower case and a trailing dot are ignored. |
| MX | 10 mail.example.com | Priority, a space, then the hostname. Case and a trailing dot are ignored. |
| TXT | v=spf1 include:example.com -all | Exactly, case included. A long record that DNS splits into several strings is joined first. |
The message beside the check reads DNS record matches, Expected DNS record is missing or DNS lookup failed. Use it for records that somebody else can change: the address of a site, mail routing, an SPF or verification record.
Certificate expiry
There is nothing to switch on. Every HTTP check on an https:// address reads the expiry date of the certificate from the same request that tests the site.
| Certificate | What Pharos does |
|---|---|
| More than 14 days left | Nothing. The edit screen of the component shows TLS certificate expires with the date. |
| 14 days or less | The edit screen adds Certificate renewal needed, and the check message reads TLS certificate expires with the date. The component stays as it is. |
| 3 days or less | The component goes to Degraded performance while the site still answers. |
| Expired, untrusted or for another hostname | The check fails, normally with the message TLS certificate problem. After the retries the component turns red and an incident opens. |
The 14 day warning is shown in the admin only. Pharos does not send a mail or a notification for it. Open the component now and then, or watch for the status change at 3 days.
Probe locations
By default every check runs from the server Pharos is on, so one broken route between that server and your service looks like an outage. A probe location is a second Pharos installation on another network that runs the same checks and reports what it saw. Each location has one vote, and a strict majority decides whether the check is up or down.
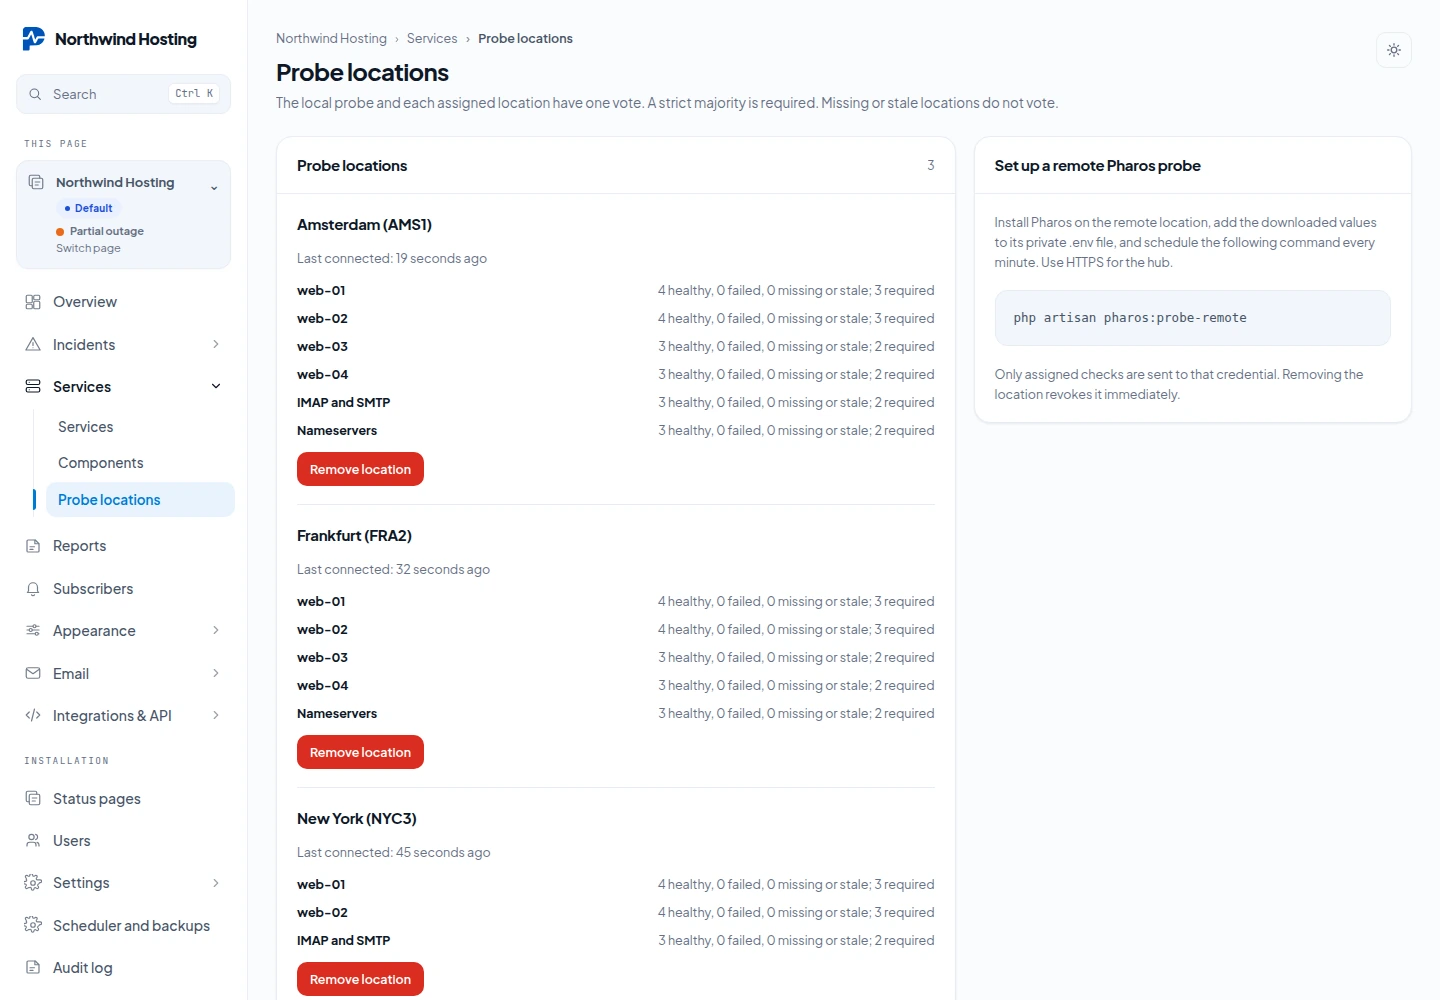
Add a location
The installation that holds the status page is the hub. The other installation only runs checks for it.
- On the hub, open Services → Probe locations. The screen is there for administrators and for people with the Page admin role on that page.
- Under Add location, type a Location name and tick the checks under Checks this location may probe. Press Add location.
- Press Download credential file once. The file
pharos-probe.envholds two lines. It can be downloaded one time only, so save it now. - Install Pharos on the remote server. Add both lines to its
.envand runphp artisan optimize:clear. - Make sure the remote installation has its cron line. The scheduler runs
php artisan pharos:probe-remoteevery minute by itself.
PHAROS_PROBE_HUB=https://status.example.com
PHAROS_PROBE_TOKEN=<the 64 characters from the file>
The hub must be reachable over HTTPS. The hub address in the file is the hub's own APP_URL, so set that to the public HTTPS address before you add a location. The remote worker refuses a plain HTTP hub. It also refuses a hub on a private address, unless an administrator of the remote installation lists that host under Settings → Single sign on, in Internal provider hosts.
How the vote works
- The local probe on the hub counts as one location. Every remote location assigned to the check adds one more.
- More than half of all locations must agree. With one remote location that means both. With two remote locations it means two out of three, so the check stays healthy when one location fails.
- A remote result older than twice the check interval, with a minimum of 120 seconds, is stale and does not vote. A location that has not reported yet does not vote either.
- When neither side reaches a majority the result is undecided. The component is set to Degraded performance, no uptime is counted for that run and no incident is opened.
The Probe locations screen shows when each location last connected and, per check, a line such as 2 healthy, 0 failed, 1 missing or stale; 2 required. A check that has no results yet says Waiting for results.
Limits and removal
- HTTP, TCP and DNS checks can be assigned. Heartbeat checks cannot: there is nothing to probe from outside.
- A status page can have up to 20 locations, and a location up to 100 checks.
- The remote worker handles at most 20 checks per run. It only picks up another check in the first seconds of a run, so that even a slow one still finishes within the minute. Quick checks go through 20 at a time, but one check that needs 30 seconds can be the only one in its run. For many slow checks, use longer intervals or spread them over more locations, or results go stale before they can vote.
- A location's credential can only fetch the checks assigned to it and send back results. It cannot change components and it cannot see other pages.
- The credential belongs to the person who added the location. It stops working when that person may no longer administer the page, for example because the Page admin role was taken away, or when the page is archived.
- Remove location revokes the credential at once.
Latency charts
Pharos keeps how long every HTTP, TCP and DNS check took. On the edit screen of a component with a check, the chart Response time · last 24 hours sits under the check settings and shows that time in milliseconds.
- The 24 hours are split into 288 steps of five minutes. Each point is the average of the runs in that step.
- A gap in the line means there was no measurement in that step: the check was not due, it was paused, or the run returned no time. Gaps are never filled in.
- Under the chart you read the Maximum and the Average over the period.
- A heartbeat has no response time, so its chart stays empty.
- With probe locations, the chart shows the time measured by the local probe on the hub.
To show the chart to your visitors, tick Show response time on the public page on the component. It is off by default and set per component. The public chart shows the line and the two figures only: no target and no check message.
The chart reads the raw check results, which Pharos keeps for 40 days. See Uptime.
Incidents
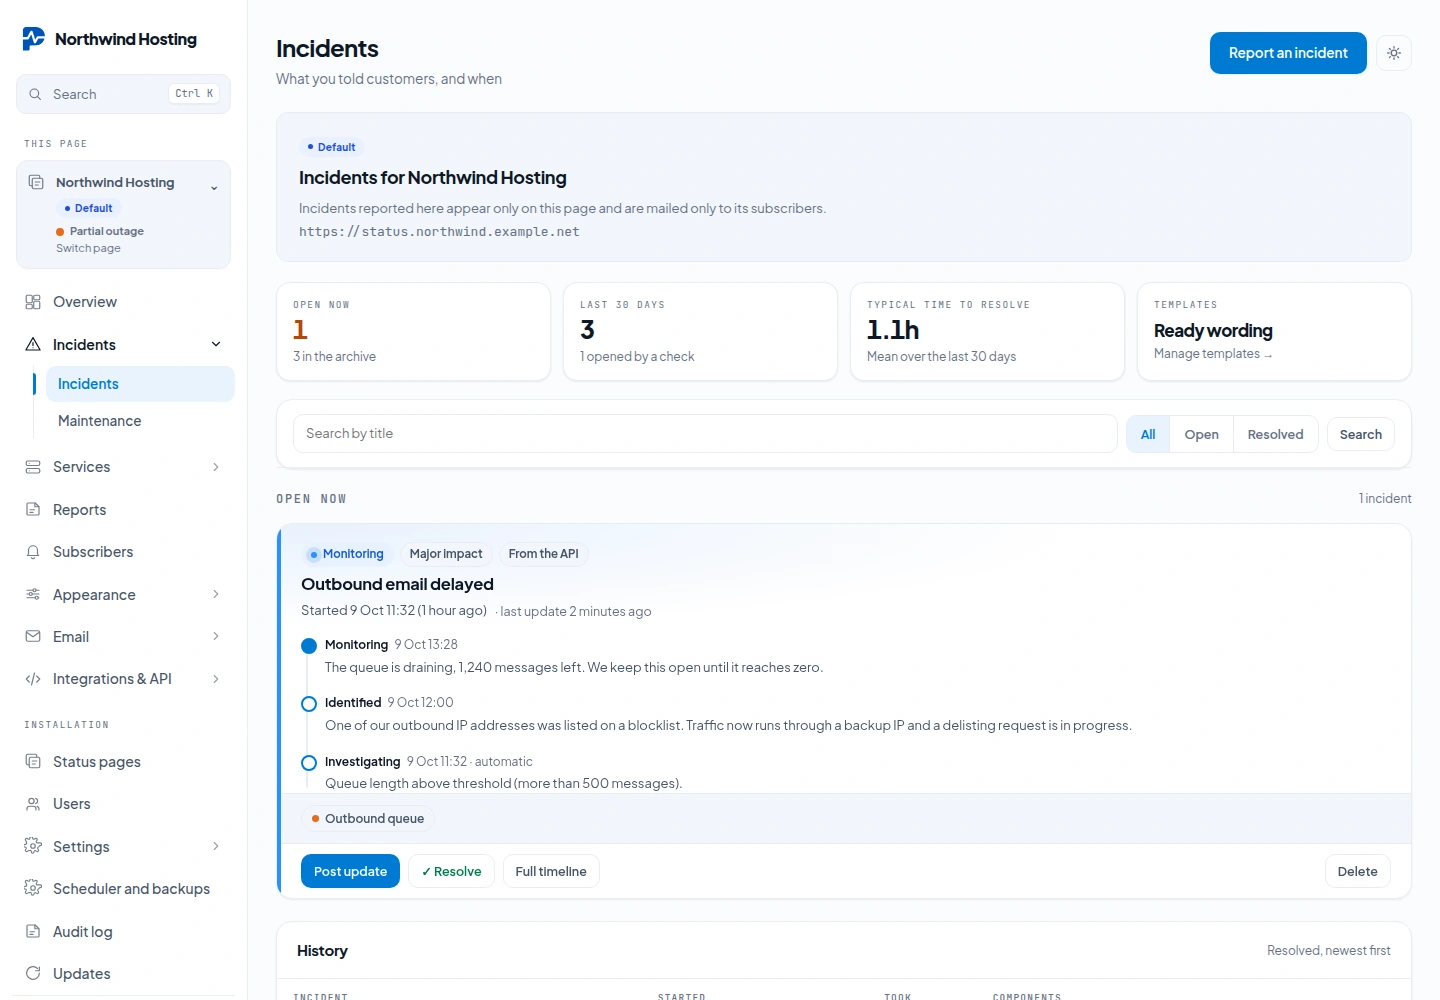
Status and impact
Incident status is Investigating, Identified, Watching or Resolved, the same integers Cachet used. Component status is separate:
| Value | Label | Counts as down |
|---|---|---|
| 1 | Operational | no |
| 2 | Degraded performance | no |
| 3 | Partial outage | yes |
| 4 | Major outage | yes |
| 5 | Under maintenance | no |
Impact (minor, major or critical) is stored separately from status and is meant for reporting and for whatever consumes the outgoing webhook.
Visibility
The incident form has two choices. Public incidents reach the status page, their own incident page, the RSS feed, subscribers and the API without a token. Internal: team only is stored and shown in the admin only.
Pharos has no sign in for visitors, so the form no longer offers "Signed in users only".
Incidents stored with that value, and API clients that still send
authenticated, keep working: such an incident stays off the public page, like
an internal one.
Message length
An incident message and an update message can be 20,000 characters at most, in the admin and in the API. A longer one is refused with a validation error, 422 in the API. Messages stored before this limit keep showing as they were.
Backdating
Set Occurred at to any past timestamp; the public page groups incidents by that date. How far back the page lists days is the Days of incident history setting, 1 to 30.
Templates with variables
Save the wording of an incident that happens more than once as a template. On the
Incidents screen, open Manage templates, then New template: a name, the
incident title and the message to customers. Report an incident offers your templates
under Use a template, and the API takes the template's API name in the
template field.
Placeholders look like {{server}}, are case-insensitive, and tolerate inner
spaces. In the API they are filled from vars; on the form you replace them
yourself before publishing. An unknown placeholder is left in the text verbatim
rather than blanked: publishing “Outage on .” to customers would be worse than publishing
the placeholder.
What happens when you resolve
Resolving puts every attached component back to operational: from the admin, from the API, and when a check closes an incident it opened. To close an incident while leaving a component degraded, name that component explicitly in the same request.
Scheduled maintenance
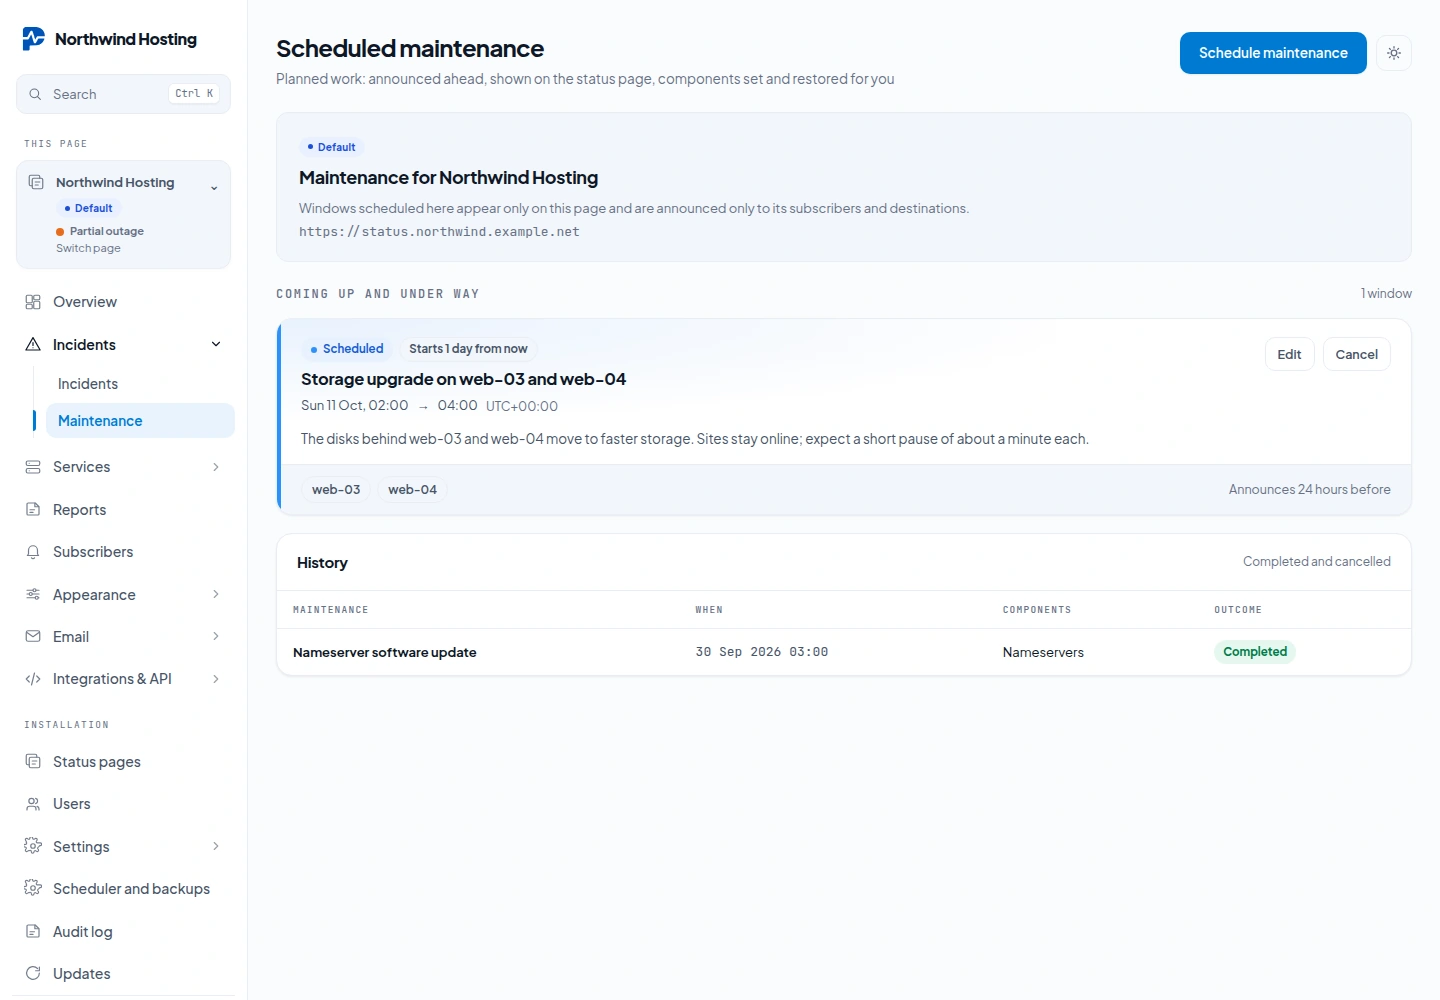
Under Incidents → Maintenance, schedule planned work per page: a title, a message, the start and end, the affected components and when to announce it (24 hours before by default). Subscribers and destinations that chose Maintenance get the announcement; at the start the components switch to Under maintenance and at the end they go back to their previous status, unless someone changed them in the meantime. Failing checks do not open outages during a running window, and cancelling one restores the components too. The public page lists upcoming and ongoing maintenance. The cron line drives all of it.
Uptime and what the bar means
Every check run adds the time since the previous run, at most one interval, to that day's
up_seconds or down_seconds, one row per component per day. That
is why a 90-day bar costs 90 rows rather than every raw result.
Who gets uptime
| Service is | Uptime comes from | Shown as |
|---|---|---|
| Checked by Pharos | Each run of its HTTP, TCP, DNS or heartbeat check | A percentage per day |
| Set from outside (API, Uptime Kuma, upstream) | The status it was last told, counted every minute | A percentage per day, marked reported in the admin |
| Set by hand | Nothing | Not measured |
Until 1.0 only the checks Pharos runs itself produced uptime, so a service fed through the API (Zabbix, n8n, a script) or by Uptime Kuma showed grey cells for ever. Now Pharos counts, every minute, the time such a service spends in the status that was reported for it:
- Operational and Degraded performance count as up.
- Partial outage and Major outage count as down.
- Under maintenance counts as neither, so maintenance is never an outage.
- A long gap, for example a scheduler that stood still, is credited for at most two minutes. Pharos does not fill in hours it did not see.
- History starts with the update to 1.0. Earlier days stay grey.
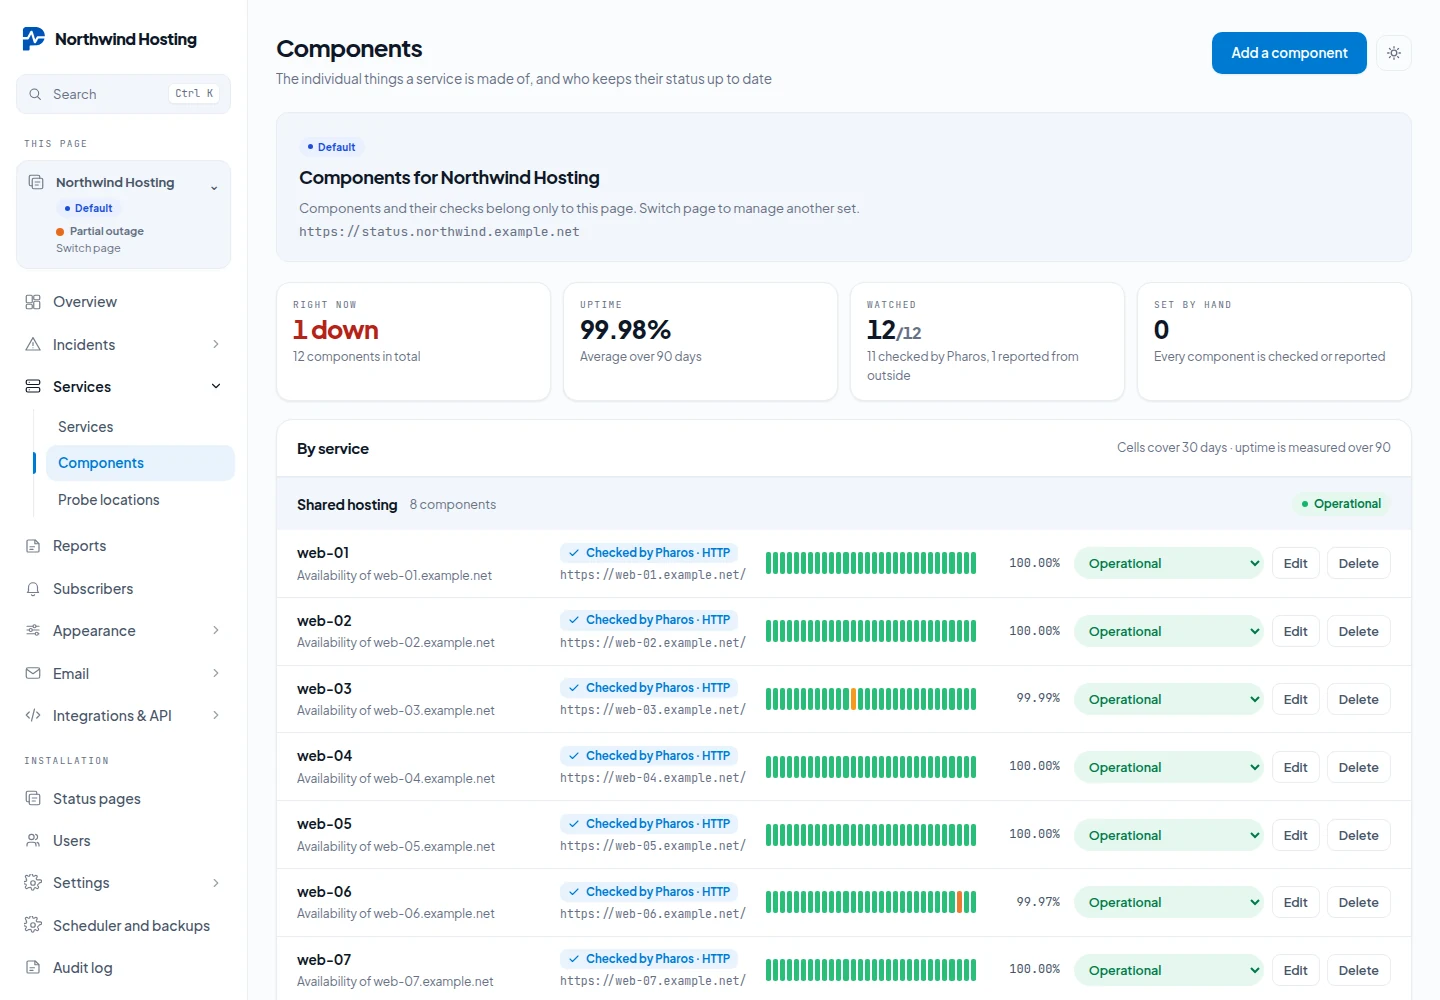
Reported uptime is only as good as the reports. If the tool that feeds a service stops sending, the service keeps its last status and keeps being counted in it. The Components screen shows via and the name of the API token that last reported, to people who may edit the page. Its Watched tile adds up what Pharos checks itself and what is reported from outside, and the Set by hand tile counts the rest.
Checks do not count time inside a maintenance window that has started for that component: those seconds are left out, they are neither up nor down. Days recorded before 1.0 are not recalculated.
| Day | Cell |
|---|---|
| 99.99% or better | green |
| 99.0% or better | amber |
| 95.0% or better | orange |
| below 95% | red |
| no data | grey |
Grey means no data, not fine. A component created yesterday shows 89 grey cells, which is the honest answer. The percentage averages only the days actually measured: counting unmeasured days as 100% would invent uptime, and counting them as 0% would punish you for installing recently.
The raw result of every check run is kept for 40 days and pruned once a day, in small
batches. The newest result of every component always stays, so a paused check keeps its last
run. Uptime figures and the 90-day bar come from the daily rows and do not change when raw
results go. Set PHAROS_CHECK_RESULT_DAYS in .env to keep
them longer or shorter. An existing SQLite file does not shrink after the first pruning: it
stops growing, and the freed space is reused.
The public page
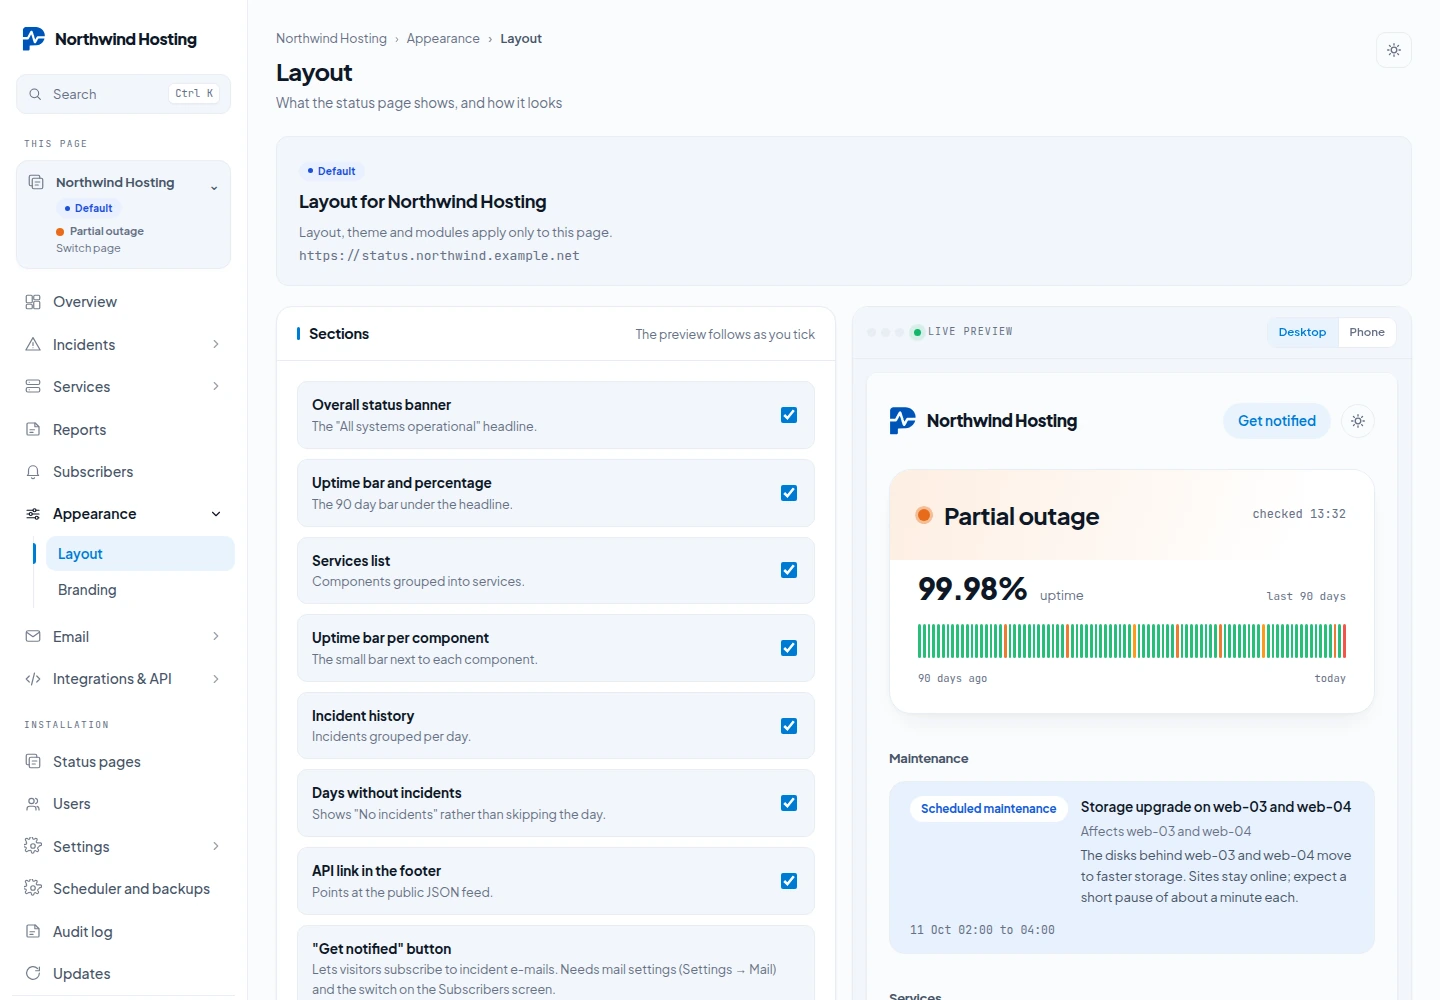
Every section is a switch under Appearance → Layout, and all of them default to on.
| Toggle | What switching it off hides |
|---|---|
| Overall status banner | The headline, the coloured dot and the “updated” stamp |
| Uptime bar and percentage | The big figure and the combined 90-day bar |
| Services list | Every service and component row |
| Uptime bar per component | The small bars and per-component figures |
| Incident history | The whole incidents section |
| Days without incidents | Quiet days are skipped instead of printing “No incidents” |
| "Get notified" button | The button that lets visitors subscribe |
| API link in the footer | The link to the public JSON feed |
Under the switches the same screen has one switch per service, and three settings for the whole page: the Public page language (see Languages), the Default theme and the Days of incident history.
Next to the Layout form is a live preview: the real page rendered from your unsaved values, with Desktop and Phone widths. It writes nothing. Service blocks that start collapsed are forced open whenever that service is down.
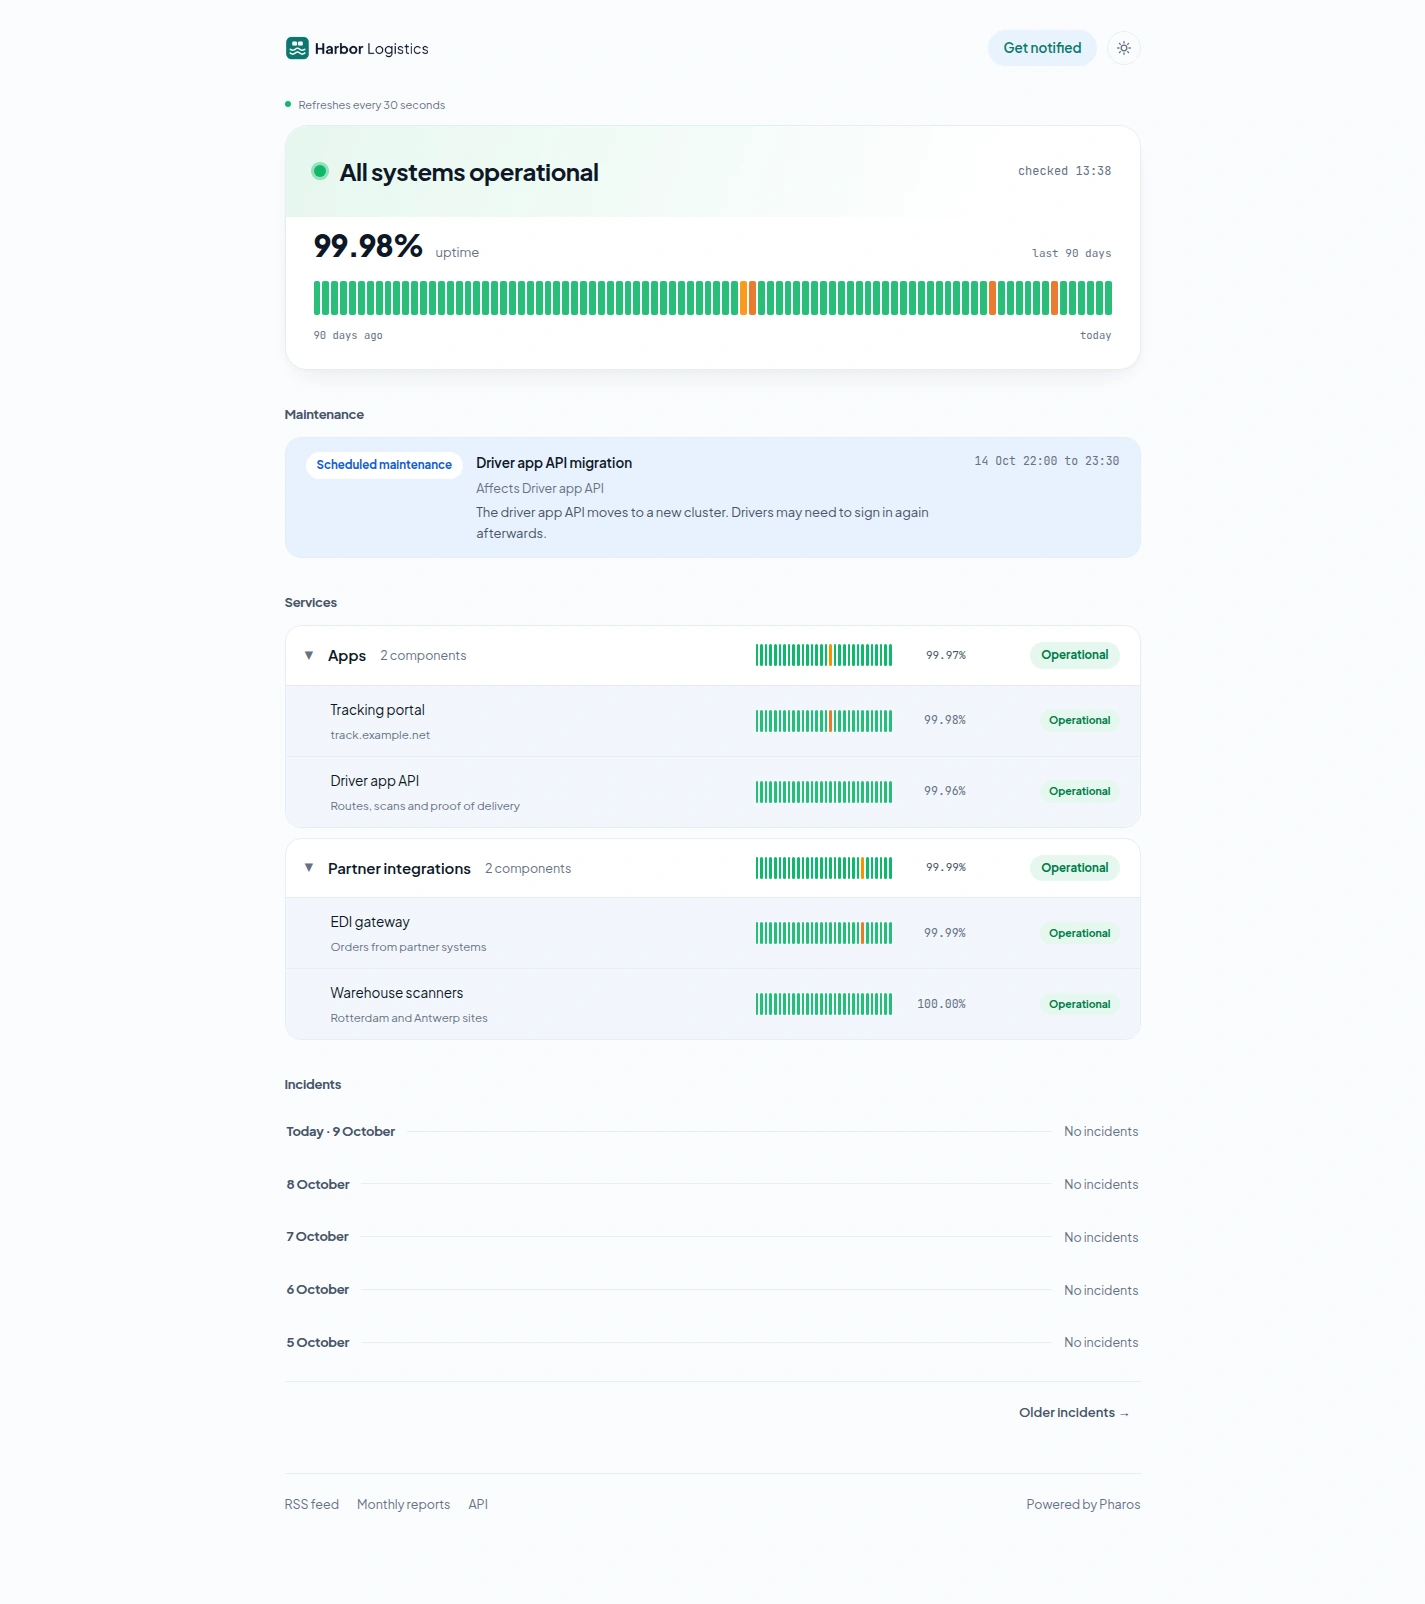
What 1.0 adds to the page
- The title of every incident links to a page of its own, with the full timeline. See Badges, RSS, incident pages and the widget.
- The footer links to the RSS feed and to Monthly reports. These two links are always there; only the API link next to them is a switch. See Monthly reports.
- The Get notified form lets a visitor follow all services or choose some. See Service subscriptions.
- A component can show its response time of the last 24 hours. That is off until you tick it per component. See Latency charts.
- The page, its dates and its mails can be in English, Dutch, German or Spanish.
With more than one status page, each has its own public page: the default page keeps /, the others live at /status/{slug} or on their own domain, with their own services, incidents, maintenance and branding.
Badges, RSS, incident pages and the widget
Four ways to show your status somewhere other than on the status page itself. All of them are public, need no token and only answer for a published page. The addresses to copy are in the admin under Reports, in the card Share your status. That card appears once the page is published.
| What | Address | Good to know |
|---|---|---|
| Badge of a component | /badges/components/{id}.svg | Cached for 30 seconds |
| Badge of a service | /badges/groups/{id}.svg | Cached for 30 seconds |
| RSS feed | /feed.xml | Cached for 60 seconds |
| Incident page | /incidents/{id} | Public incidents only |
| Widget | /embed.js, which reads /widget.json | Refreshes every minute |
On a second status page every address gets /status/{slug} in front, for example /status/{slug}/feed.xml. Disabled components and components in a hidden service are not available through any of them.
Status badges
A badge is a small SVG image: the name on the left, the current status on the right, in the colour of that status. It links to the status page. Open Status badges in the card Share your status for the address of every public component, then use it as an image:
<img src="https://status.example.com/badges/components/7.svg" alt="API status">
A service has a badge too, under /badges/groups/{id}.svg. It shows the status of the service as a whole. The id of a service is the number the API returns under /api/v1/groups.
RSS feed
/feed.xml is an RSS 2.0 feed with the 50 most recent public incidents and the 50 most recent maintenance windows that were not cancelled. An incident item carries the title, the text of the latest update and a link to its incident page. The public page links to the feed in its footer, and Share your status has an RSS feed button.
Incident pages
Every public incident has an address of its own, /incidents/{id}: the title, the status, when it started, the affected services and every update in order. The incident titles on the status page link to it, and so do the items in the feed. An internal incident answers with a 404 there.
The widget
Copy the script tag under Copy this widget into your website and paste it where the status should appear:
<script src="https://status.example.com/embed.js" defer></script>
It puts a small link right after the script tag: a coloured dot, the name of the page and its current overall status. The link opens the status page in a new tab. The widget fetches /widget.json again every minute, without cookies. When that request fails it says Status unavailable instead of showing an old status.
If you would rather build your own, read /widget.json yourself. It returns status (1 to 5), label, name and url, and it may be fetched from any website.
Subscribers
Visitors can ask to be told when something breaks. The Get notified button on the status page takes an address and sends a confirmation link that is good for 24 hours; nothing is mailed to an address that has not clicked it. From then on every update you post on a public incident goes out as one e-mail, and so does every maintenance announcement, with an unsubscribe link in every mail and a one-click unsubscribe header for mail clients that offer one. Opening the unsubscribe link shows a page with an Unsubscribe button first, so a mail scanner that follows links cannot unsubscribe anyone.
A subscriber follows all services or only the ones they choose. See Service subscriptions. Mails go out in the language of the status page, see Languages.
Sending runs from the same cron line as the checks (php artisan schedule:run every minute), so posting an update never waits on an SMTP server. Mail leaves through the installation's own MAIL_* settings in .env; Settings → Central mail shows what is configured and sends you a test.
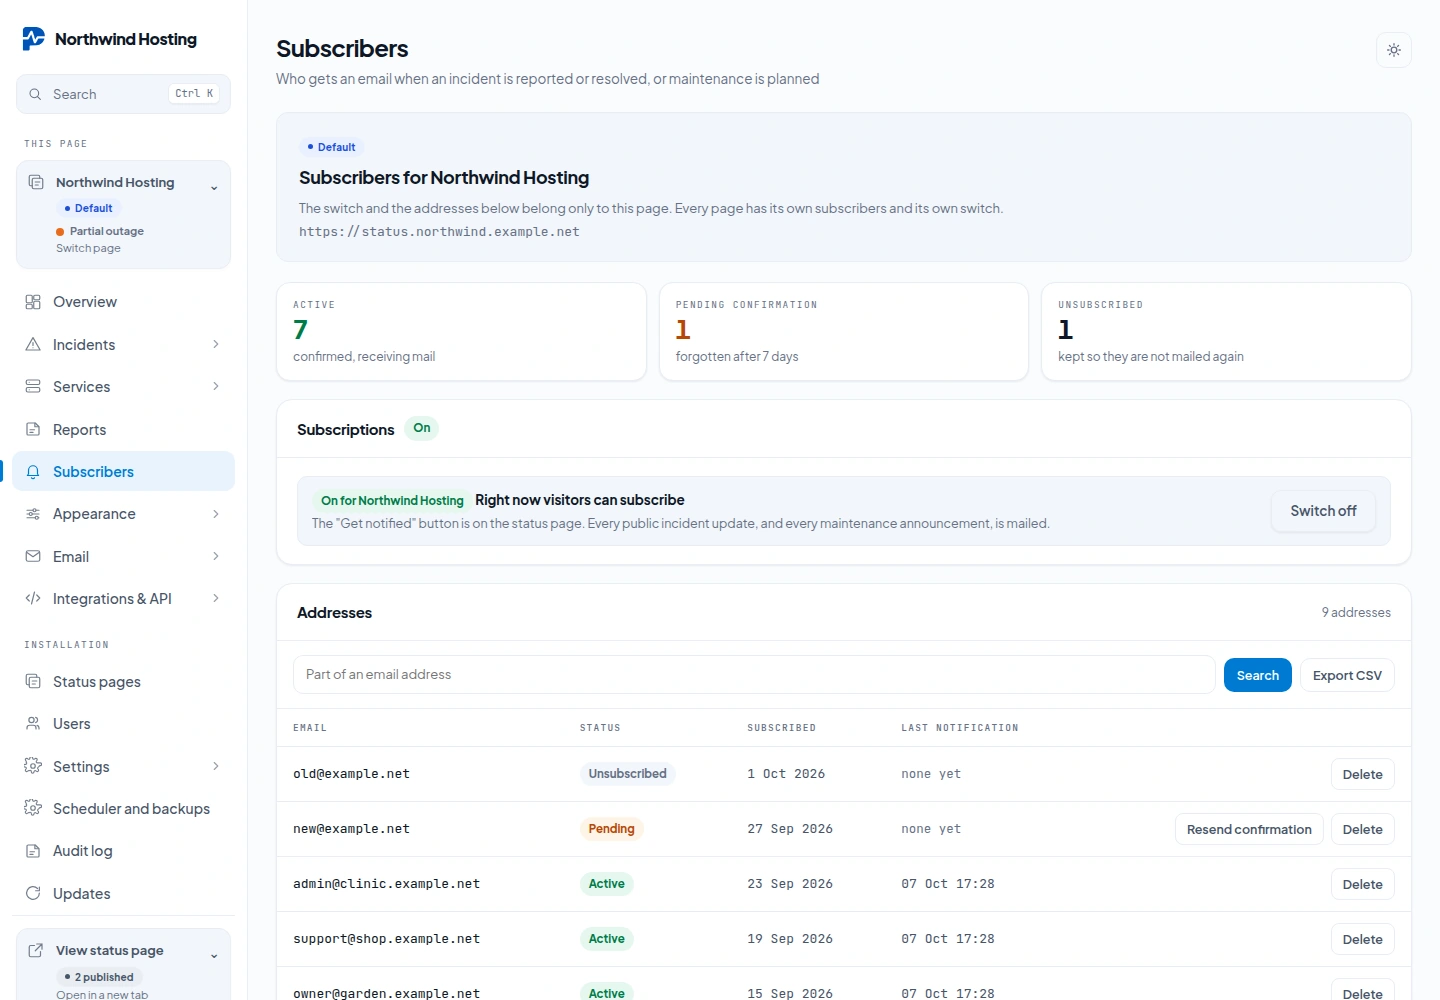
Admin → Subscribers lists who is in, who has not confirmed yet (forgotten after seven days) and who left. Search, export the active addresses as CSV, Resend confirmation to a pending address, or delete an address for a "forget me" request. The switch at the top turns subscriptions on or off for this page; a new page starts with it off.
Subscribers can also be managed over the API: list, add, change the chosen services and delete. That needs a token whose owner administers the page. An address added through the API starts as pending and gets no mail by itself; send the confirmation with Resend confirmation. See API and tokens.
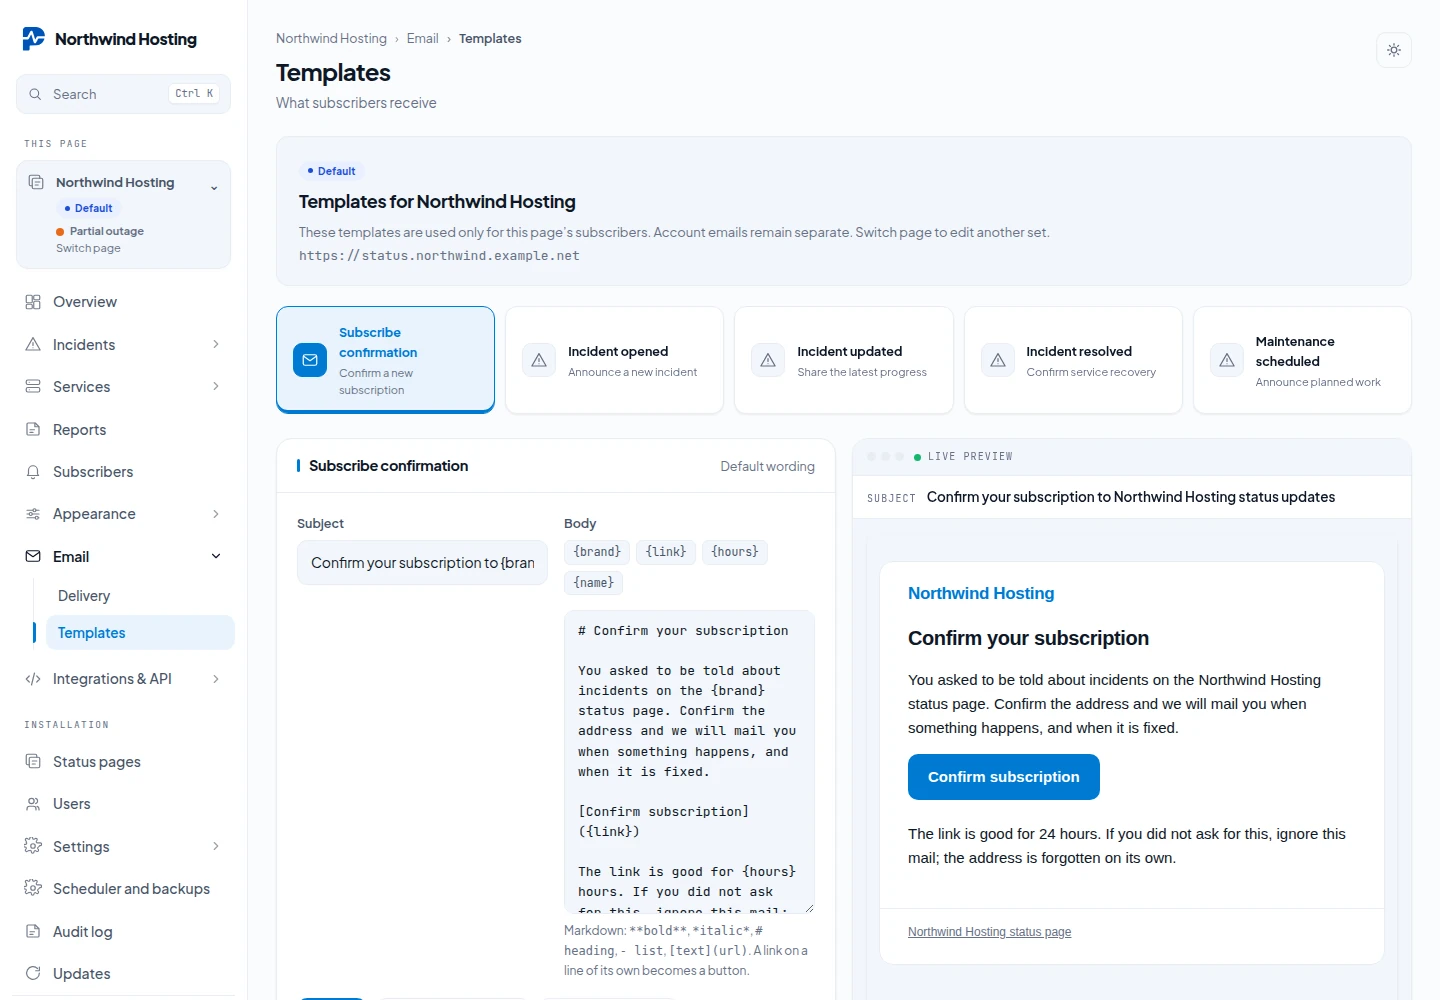
The wording of the five mails (confirmation, incident opened, updated, resolved, and maintenance scheduled) is a subject line and a Markdown body with tags such as {incident}, {status}, {message} and {components}. You edit the body; the frame around it (logo, accent colour, links to the status page and to unsubscribe) is always there. Editing the templates is part of the Brand pack; without it the built-in wording is used and you can still preview it.
Service subscriptions
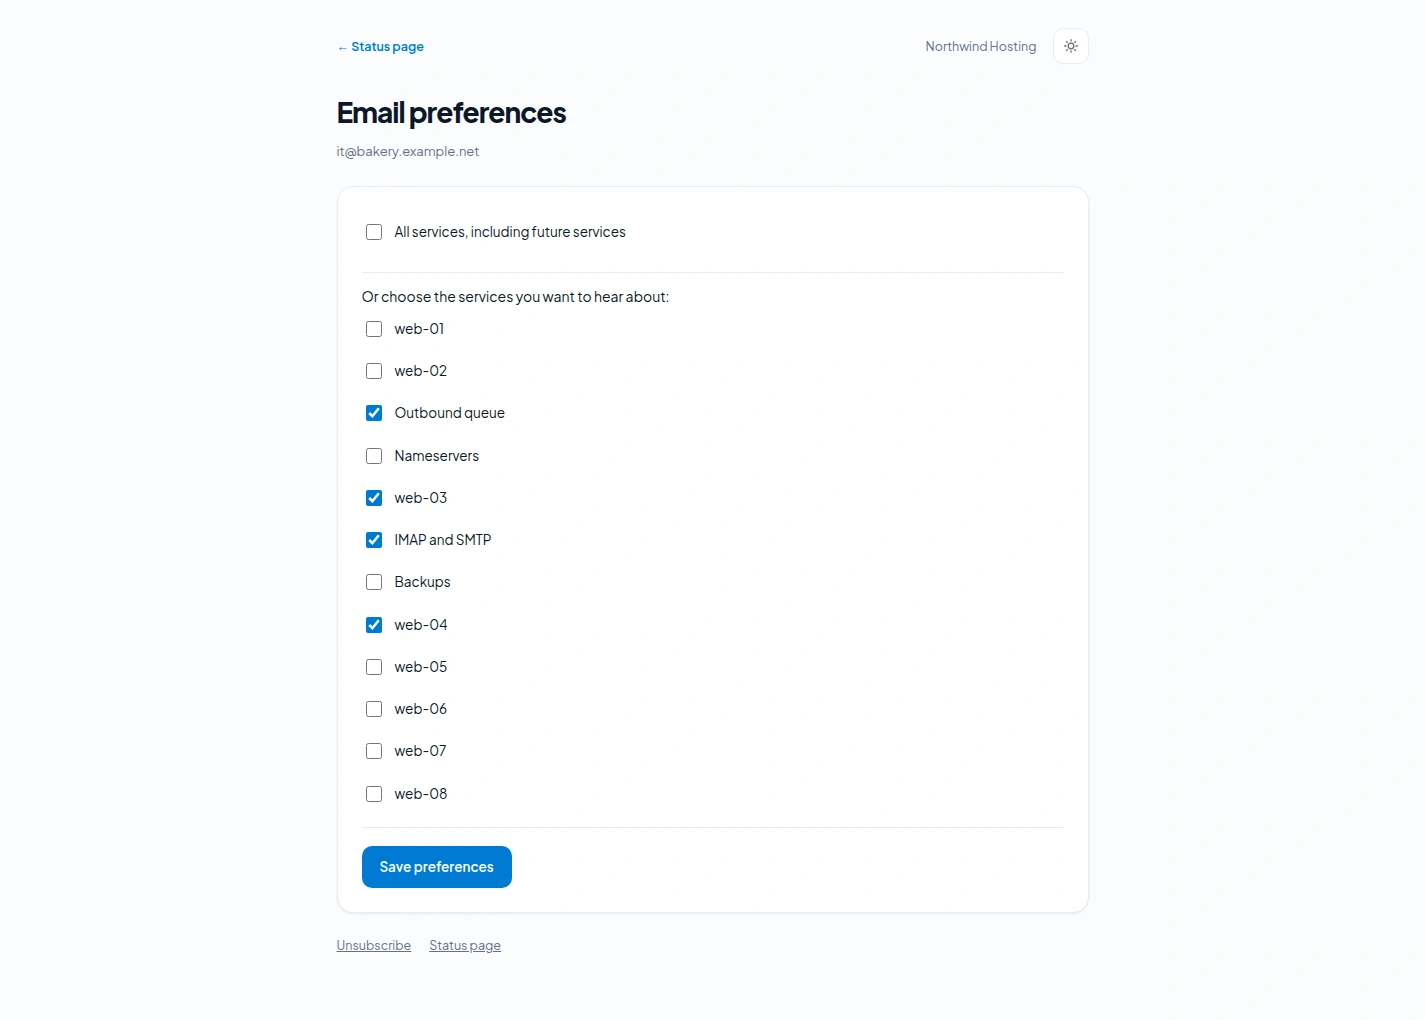
A subscriber does not have to receive everything. The Get notified form on the status page has a box All services, ticked by default, and a list under Choose services. Someone who only cares about a few services unticks the box and picks them from the list.
- All services includes services you add later.
- The list holds the public components of the page. It is only offered when the Services list section of the page is switched on.
- Confirmation works as before: nothing is sent until the address has clicked the link in the confirmation mail.
- People who subscribed before 1.0 keep receiving everything. Nothing changes for them until they change it themselves.
Changing the choice later
The page a subscriber lands on after confirming has a link Manage service preferences, and every incident and maintenance mail has Manage subscription in its footer, next to the unsubscribe link. Both open the Email preferences page for that address: tick All services, including future services or choose the services, then Save preferences.
The link is signed and belongs to one address. Signing up again through Get notified with an address that is already active changes nothing, so an outsider cannot alter what somebody else receives.
What a subscriber then receives
| Incident or maintenance window | All services | Chosen services |
|---|---|---|
| Affects a chosen component | Mailed | Mailed |
| Affects only other components | Mailed | Not mailed |
| Has no components attached | Mailed | Mailed |
An incident without components is a general notice, so it goes to everyone. Attach the affected components to an incident if you want the choice of your subscribers to count.
Editing the mail templates? The tag {preferences} holds the link to the preferences page of the subscriber, for the incident and maintenance mails. You do not need it for the footer link: that one is always there.
Notification e-mails
Four mails carry an incident to your subscribers: confirm your address, incident opened, incident updated and resolved. Each is a subject line and a Markdown body you can rewrite under Admin → Mail templates. Tags are filled in when the mail is sent:
| Tag | Becomes |
|---|---|
{incident} | The incident's name |
{status} | Investigating, Identified, Watching or Resolved |
{message} | The update text you posted |
{components} | The affected components, comma-separated |
{link} | A link back to your public status page |
{brand} | Your status page's name |
A fifth template, Maintenance scheduled, announces planned work. It has its own tags:
{maintenance} for the title, and {starts} and {ends} for the
window. The incident and maintenance mails also know {unsubscribe} and
{preferences}, the links to leave or to change the
chosen services. The templates live under
Email → Templates of the page.
You write the words; the frame around them (logo, accent colour, the coloured rule and the unsubscribe footer) is always applied. The rule and accent follow the incident's own state, so an outage mail reads red and a resolved mail reads green without you setting a colour. A live preview sits beside the editor. Editing the wording is part of the Brand pack; without it the built-in wording is used, and you can still preview it.
Monthly uptime reports
Pharos turns the uptime it recorded into a report per calendar month: one row per component, in the column Service, on screen, as CSV or as PDF. Open Reports in the admin of the page, pick a month, press Show report, and use Download CSV or Download PDF.
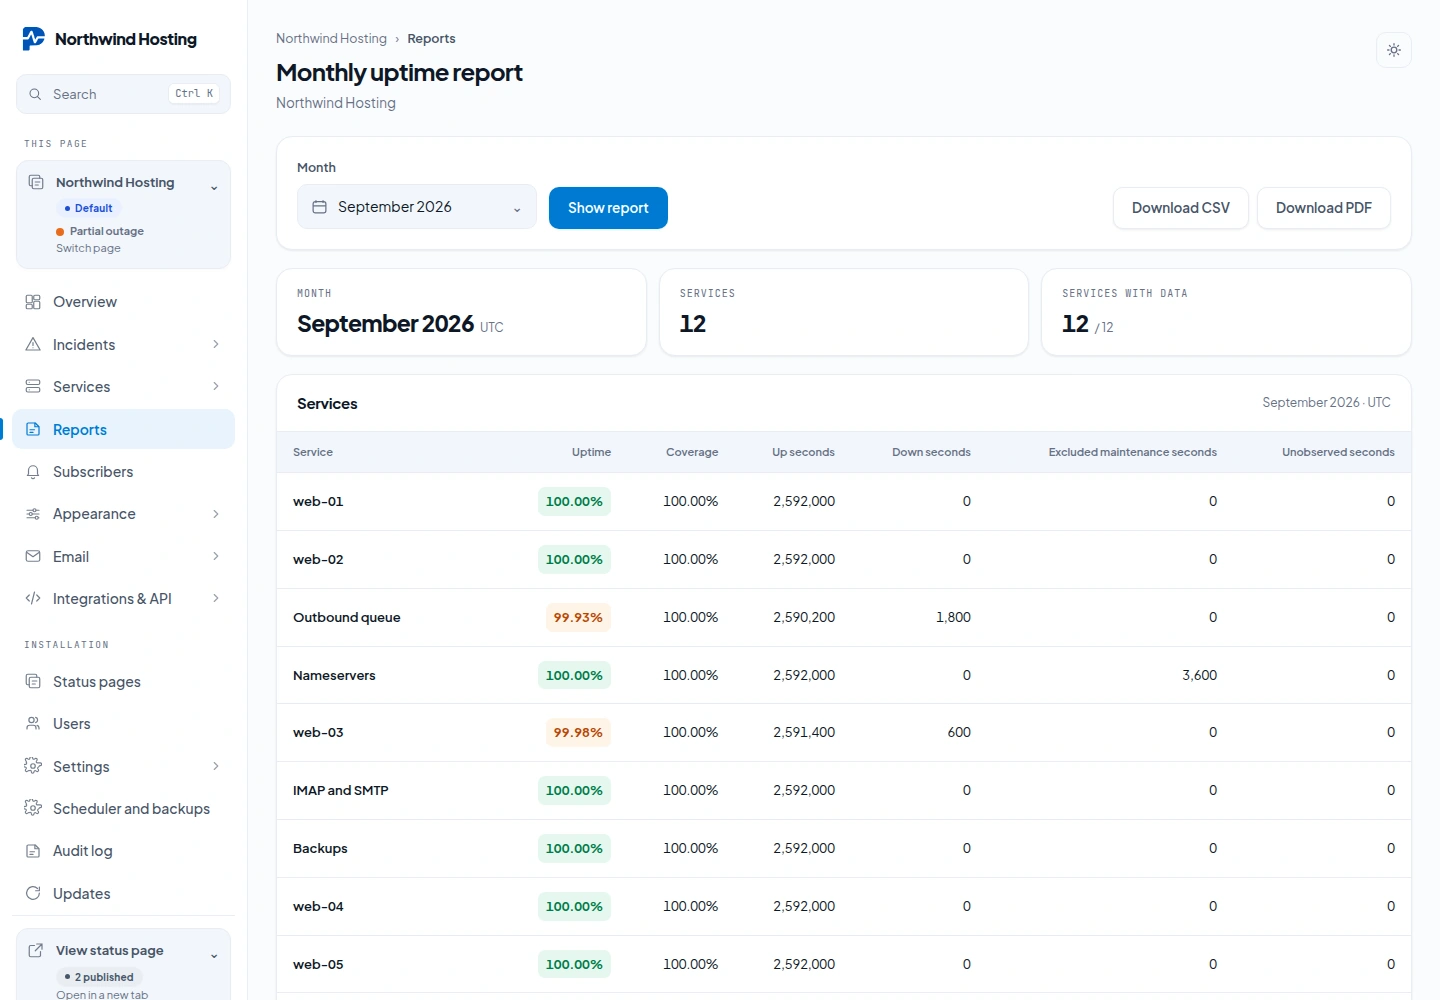
| Column | Meaning |
|---|---|
| Uptime | Up seconds as a share of the seconds that were measured. No data when nothing was measured. |
| Coverage | How much of the month was measured at all, after maintenance is taken out. |
| Up seconds, Down seconds | The measured time, from the daily uptime rows. |
| Excluded maintenance seconds | Time inside maintenance windows that actually started. Overlapping windows count once. |
| Unobserved seconds | Time in the month that was neither measured nor maintenance. |
Months are UTC calendar months. The daily rows are stored per UTC day, so a report cannot follow your local midnight. Do not read it as an SLA figure in local time. Time that was not measured is never counted as up: it lowers the coverage, not the uptime.
The public report
Visitors get the same report at /reports, with /reports.csv and /reports.pdf for the downloads. The footer of the status page links to it as Monthly reports. Add ?month=2026-09 for a given month, from January 2000 up to the current one. The current month stops at the present moment.
https://status.example.com/reports?month=2026-09
https://status.example.com/reports.csv?month=2026-09
https://status.example.com/reports.pdf?month=2026-09
- The public report lists what visitors can see on the page. The report in the admin also lists hidden services and disabled components.
- People with the Read only role on the page can open and download the report in the admin.
- On a second status page the public address is
/status/{slug}/reports.
Limits
- A report covers up to 500 components and 2000 maintenance windows per page per month. Above that Pharos refuses the report with a message, and leaves nothing out silently. Split a very large page.
- Days recorded before 1.0 may still include time that fell inside maintenance. Those totals are kept as they are, and the report says so.
- A service whose status is set by hand has no measurements, so it shows No data.
- The PDF needs PHP's
domextension next tombstring. The installers do not check fordom, so enable it if the PDF download fails. - Report pages are limited to 15 requests per minute per visitor.
API and tokens
Create tokens under Integrations & API → API tokens, or from the shell. A token is 40 characters and only its SHA-256 hash is stored, so it is shown exactly once.
php artisan pharos:token "n8n" --user=you@example.com --page=1 --scope=write
The command needs an owner (--user, the email of an account with access to the page) and a page (--page, the id of the status page). The first page is normally 1. For every other page it is the number in the admin address, as in /admin/pages/2/overview. Without --scope it makes a Write token.
A token belongs to one status page and one owner, and it has one of two kinds of access:
| Access | What it may do |
|---|---|
| Read | See components and incidents, including the ones that are not public. It cannot change anything. In the admin, Read is the choice that is already selected. |
| Write | Also change component status, post incidents and use the other writing endpoints. It only works while its owner may edit the page: lower or remove the owner's role and the token loses its rights at once. |
Endpoints that take a token accept either header; the second exists so Cachet scripts need no editing:
Authorization: Bearer <token>
X-Cachet-Token: <token>
The addresses under /api/v1/ serve the first status page. Every other page has
the same endpoints under /api/v1/pages/{slug}/, with a token of that page. The
API answers on the main address of the installation only, not on a custom domain of a page.
Reading, without a token
curl -s https://status.example.com/api/v1/components
curl -s https://status.example.com/api/v1/incidents
/components returns the Cachet envelope with the same field names and status
integers. /incidents returns the 50 most recent public incidents with their
updates and components.
Setting one component
curl -sX PUT https://status.example.com/api/v1/components/1 \
  -H "Authorization: Bearer $PHAROS_TOKEN" \
  -H "Content-Type: application/json" \
  -d '{"status": 4}'
This does not open an incident. If a built-in check also watches that component, the next check run overwrites whatever you set, so pick one owner per component.
Opening an incident across several components
curl -sX POST https://status.example.com/api/v1/incidents \
  -H "Authorization: Bearer $PHAROS_TOKEN" \
  -H "Content-Type: application/json" \
  -d '{
    "template":     "server-unreachable",
    "vars":         { "server": "web-06.example.net", "started_at": "16:50" },
    "status":       "investigating",
    "impact":       "major",
    "components":   { "7": "major_outage", "8": "degraded" },
    "auto_resolve": true
  }'
Status is a name, not an integer: investigating,
identified, watching or resolved. Component keys may
be an id or a name. An unrecognised component status silently becomes operational, so check
your spelling.
Adding an update
curl -sX POST https://status.example.com/api/v1/incidents/12/updates \
  -H "Authorization: Bearer $PHAROS_TOKEN" \
  -H "Content-Type: application/json" \
  -d '{"status": "resolved", "message": "Back up at 17:22."}'
Services, maintenance and subscribers
1.0 adds endpoints for the things you could only manage in the admin. Paths are relative to /api/v1, or to /api/v1/pages/{slug} for another page.
| Endpoint | What it does | Token |
|---|---|---|
GET /ping | Answers {"data":"Pong!"}, as Cachet did. | None |
GET /groups, GET /groups/{id} | Lists the services, or returns one. | Read |
POST /groups, PUT and DELETE /groups/{id} | Creates, changes or deletes a service. Fields: name, visible, collapsed, position. | Write |
POST /components | Creates a component. Fields: name, and optionally description, status (1 to 5), group_id, enabled, show_uptime, position. | Write |
DELETE /components/{id} | Deletes a component. An incident that its check opened is closed with a reason. | Write |
DELETE /incidents/{id} | Deletes an incident. | Write |
GET /maintenance, GET /maintenance/{id} | Lists the 100 most recent maintenance windows, or returns one. | Read |
POST /maintenance, PUT and DELETE /maintenance/{id} | Schedules, changes or removes a window. Fields: title, message, starts_at, ends_at, announce_minutes, components (a list of ids). | Write |
GET /subscribers, GET /subscribers/{id} | Lists subscribers, 50 per page (per_page up to 100, page), or returns one. | Read, owner administers the page |
POST /subscribers, PUT and DELETE /subscribers/{id} | Adds a pending address, changes the chosen services (all_services, component_ids) or deletes the address. | Write, owner administers the page |
GET /metrics | Status and uptime for Prometheus. See Prometheus metrics. | Read |
curl -sX POST https://status.example.com/api/v1/maintenance \
  -H "Authorization: Bearer $PHAROS_TOKEN" \
  -H "Content-Type: application/json" \
  -d '{
    "title":            "Storage upgrade on web-01",
    "starts_at":        "2026-10-20T20:00:00+02:00",
    "ends_at":          "2026-10-20T22:00:00+02:00",
    "announce_minutes": 1440,
    "components":       [7, 8]
  }'
- Times need the full form with seconds and an offset, as in the example. The end must be after the start and in the future.
announce_minutesis one of 0 (do not announce), 60, 360, 1440, 2880, 4320 or 10080.PUTonly changes a window that has not started yet. Deleting a running window first puts its components back.- An address added through
POST /subscribersis pending and gets no mail from the call itself. The API never returns the private link token of a subscriber or the IP address they signed up from. - A component made with
POST /componentsis marked as set from outside, so its uptime is counted from the status you report. - A request body may be 256 KiB at most on these endpoints, and they are limited to 60 requests per minute per calling address.
- With a valid token these endpoints also work for a page that is not published yet. An archived page is not available, and
/pingonly answers for a published page.
Uptime Kuma
Pharos accepts component updates through its REST API and success pings through its heartbeat endpoint. A Kuma push monitor receives heartbeats; it is not, by itself, an outgoing bridge to Pharos.
Webhook endpoint. Kuma’s Webhook notification can set a component directly: post it to /api/v1/integrations/kuma/{component} with an API token that can write, sent as Authorization: Bearer. Up sets Operational, down sets Major outage, maintenance sets Under maintenance and pending changes nothing. Use a component without a check of its own. Kuma’s test notification carries no heartbeat status and is refused; check the connection with a real monitor change. Under Integrations & API → Bring in the guide shows the address for each component. A component fed this way gets its uptime counted from the status Kuma reports, see Uptime.
Heartbeat. Alternatively, supply and test an adapter that reports successful checks periodically, or a workflow that updates Pharos through the API. A notification sent only when status changes is not a periodic heartbeat.
See API and tokens and heartbeat checks for the receiving endpoints. Verify failure, recovery and loss of the adapter before using this in production.
n8n and the outgoing webhook
Inbound is just the API: an HTTP Request node posting to
/api/v1/incidents or /api/v1/components/{id}.
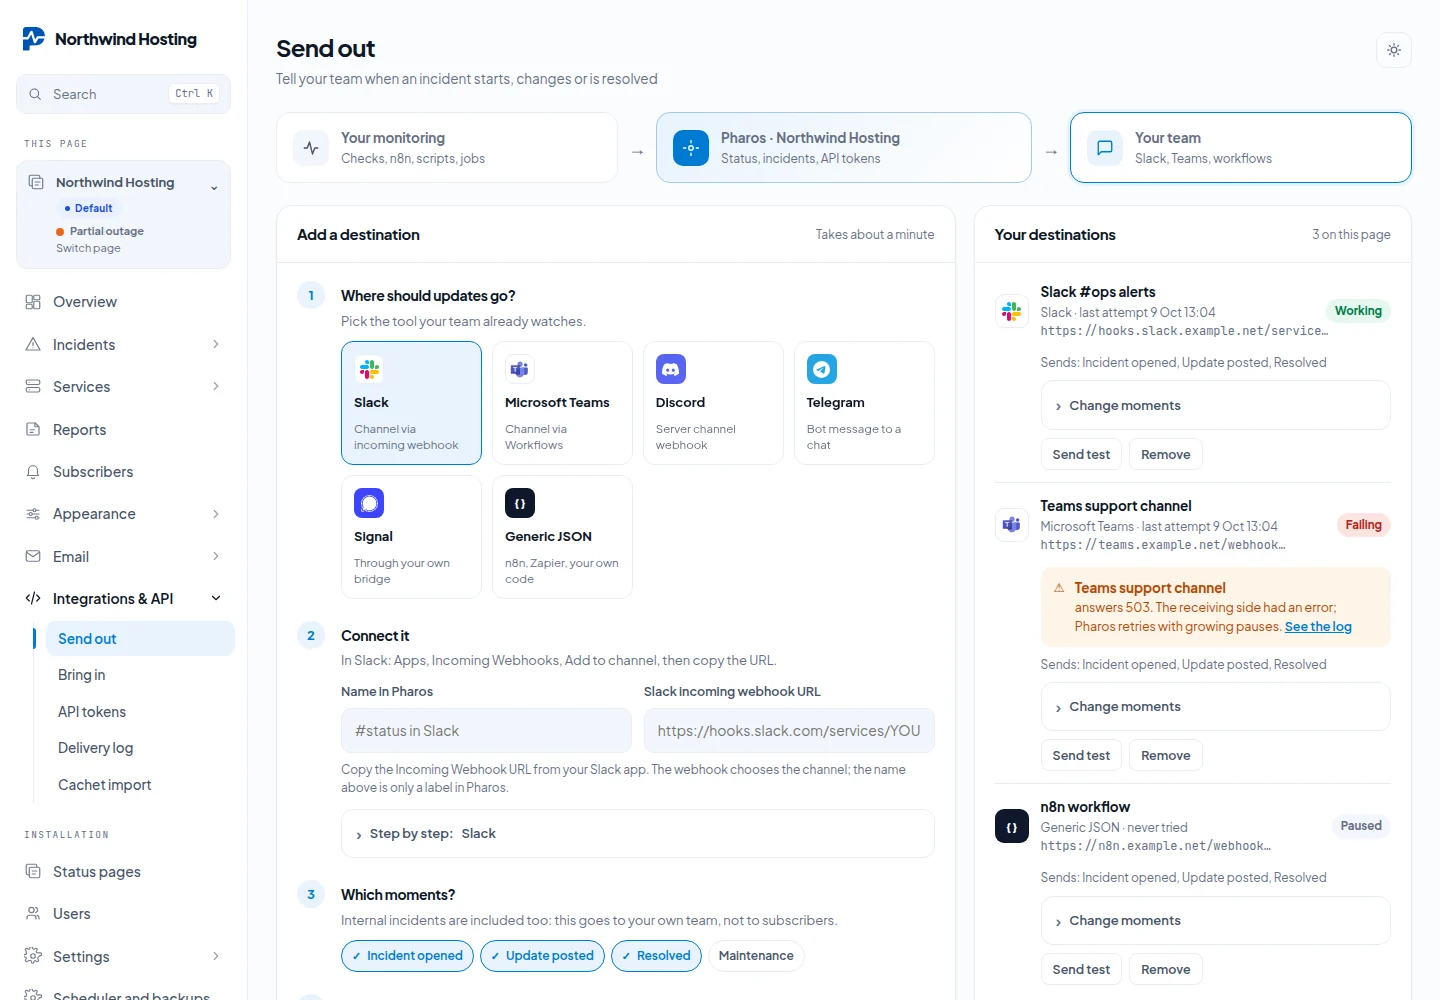
Outbound is configured under Integrations → Send out. Paste an n8n webhook URL and save; the first save generates a 32 character signing secret. It fires on the moments you tick for that destination (incident opened, update posted, resolved, maintenance), whether the incident came from you, the API, or a check.
{
  "event": "incident.created",
  "incident": {
    "id": 12,
    "name": "Mail queue backed up",
    "status": "Identified",
    "impact": "major",
    "occurred_at": "2026-08-25T16:50:03+00:00",
    "resolved_at": null,
    "components": ["Mail relay", "Webmail"]
  }
}
Every request carries X-Pharos-Signature: a lowercase hex HMAC-SHA256 of the
exact request body, keyed with your secret. Verify it: anyone who learns your webhook URL
can otherwise forge events.
const expected = crypto.createHmac('sha256', SECRET)
  .update(req.body)              // the RAW body; a JSON parser changes the bytes
  .digest('hex');

if (!crypto.timingSafeEqual(Buffer.from(expected), Buffer.from(received))) {
  return res.status(401).json({ error: 'bad signature' });
}
Delivery is one attempt with a five-second timeout and no retries. A slow receiver must never hold up publishing an incident, so a failure is logged and never shown to you mid-outage.
Zabbix and Grafana
Neither has a Pharos-specific integration; both use the API.
Zabbix: create a Webhook media type with parameters for the URL, token and component id, and attach it to an action.
var p = JSON.parse(value), req = new HttpRequest();
req.addHeader('Content-Type: application/json');
req.addHeader('Authorization: Bearer ' + p.pharos_token);

// event_value "1" = problem, "0" = recovery
var body = JSON.stringify({ status: p.event_value === '1' ? 4 : 1 });
return req.post(p.pharos_url + '/api/v1/components/' + p.component_id, body);
Grafana: its webhook posts Grafana's own alert JSON, which Pharos does not parse.
Point the contact point at a small relay (an n8n webhook node is enough) and have the relay
call the API. Map firing to 4 and resolved to 1. Going the other
way, /api/v1/components needs no token, so the Infinity datasource can chart
current status directly.
Prometheus metrics
Pharos has a metrics endpoint in the Prometheus text format. It gives the current status and the uptime of every enabled component of a status page, so you can chart or alert on them next to your other metrics. It needs an API token; a Read token is enough.
curl -s https://status.example.com/metrics \
  -H "Authorization: Bearer $PHAROS_TOKEN"
| Metric | Type | Value |
|---|---|---|
pharos_component_status | gauge | 1 operational, 2 degraded, 3 partial outage, 4 major outage, 5 maintenance. |
pharos_component_uptime_ratio | gauge | The share of measured seconds that were up over the last 30 UTC days, from 0 to 1. NaN when nothing was measured. |
# HELP pharos_component_status Current component status (1 operational, 2 degraded, 3 partial outage, 4 major outage, 5 maintenance).
# TYPE pharos_component_status gauge
pharos_component_status{component_id="7",name="API"} 1
# HELP pharos_component_uptime_ratio Fraction of observed seconds up over 30 UTC days; NaN means no observations.
# TYPE pharos_component_uptime_ratio gauge
pharos_component_uptime_ratio{component_id="7",name="API"} 0.999306
Every series has two labels, component_id and name. Targets, check messages and credentials are never part of the output. Up to 5000 components are included.
Addresses
/metricsand/api/v1/metricsgive the first status page./status/{slug}/metricsand/api/v1/pages/{slug}/metricsgive another page, with a token of that page.- Use the main address of the installation. A custom domain of a status page does not accept API tokens.
- The endpoint is limited to 60 requests per minute, which is plenty for a scrape every 30 or 60 seconds.
A scrape job needs the token as a bearer token and the path, nothing else:
scrape_configs:
  - job_name: pharos
    scheme: https
    metrics_path: /metrics
    authorization:
      credentials: "<token>"
    static_configs:
      - targets: ["status.example.com"]
Hidden services are included here, unlike on the public page: the token is what decides who may read. Disabled components are left out.
Migrating from Cachet 2.x
Three things are deliberately identical, so existing scripts survive:
GET /api/v1/components: same path, same envelope, same field names.- Status integers: 1 operational, 2 degraded, 3 partial, 4 major. Pharos adds 5 for maintenance.
X-Cachet-Tokenis accepted everywhere Bearer is, andPOSTworks as an alias forPUTon a component.
What needs editing:
- Creating incidents. Cachet took an integer status and a single component; Pharos takes a status name and a components object.
- Endpoints that do not exist here: Cachet's metrics and metric points, actions, version, schedules, and fetching a single incident. Planned work lives under
/maintenance, and/metricshere is the Prometheus endpoint, not Cachet's metrics. - No pagination parameters on components and incidents. Components return in one page; incidents are capped at the 50 most recent. Only the subscriber list is paged.
Since 1.0 these do exist: /ping, component groups, /subscribers, creating and deleting components, and deleting an incident. Mind one path: groups live under /groups here, not under Cachet's /components/groups. All of them are listed under API and tokens.
Your existing data does not have to be typed in again. See Importing from Cachet 2.x for the importer.
Importing from Cachet 2.x
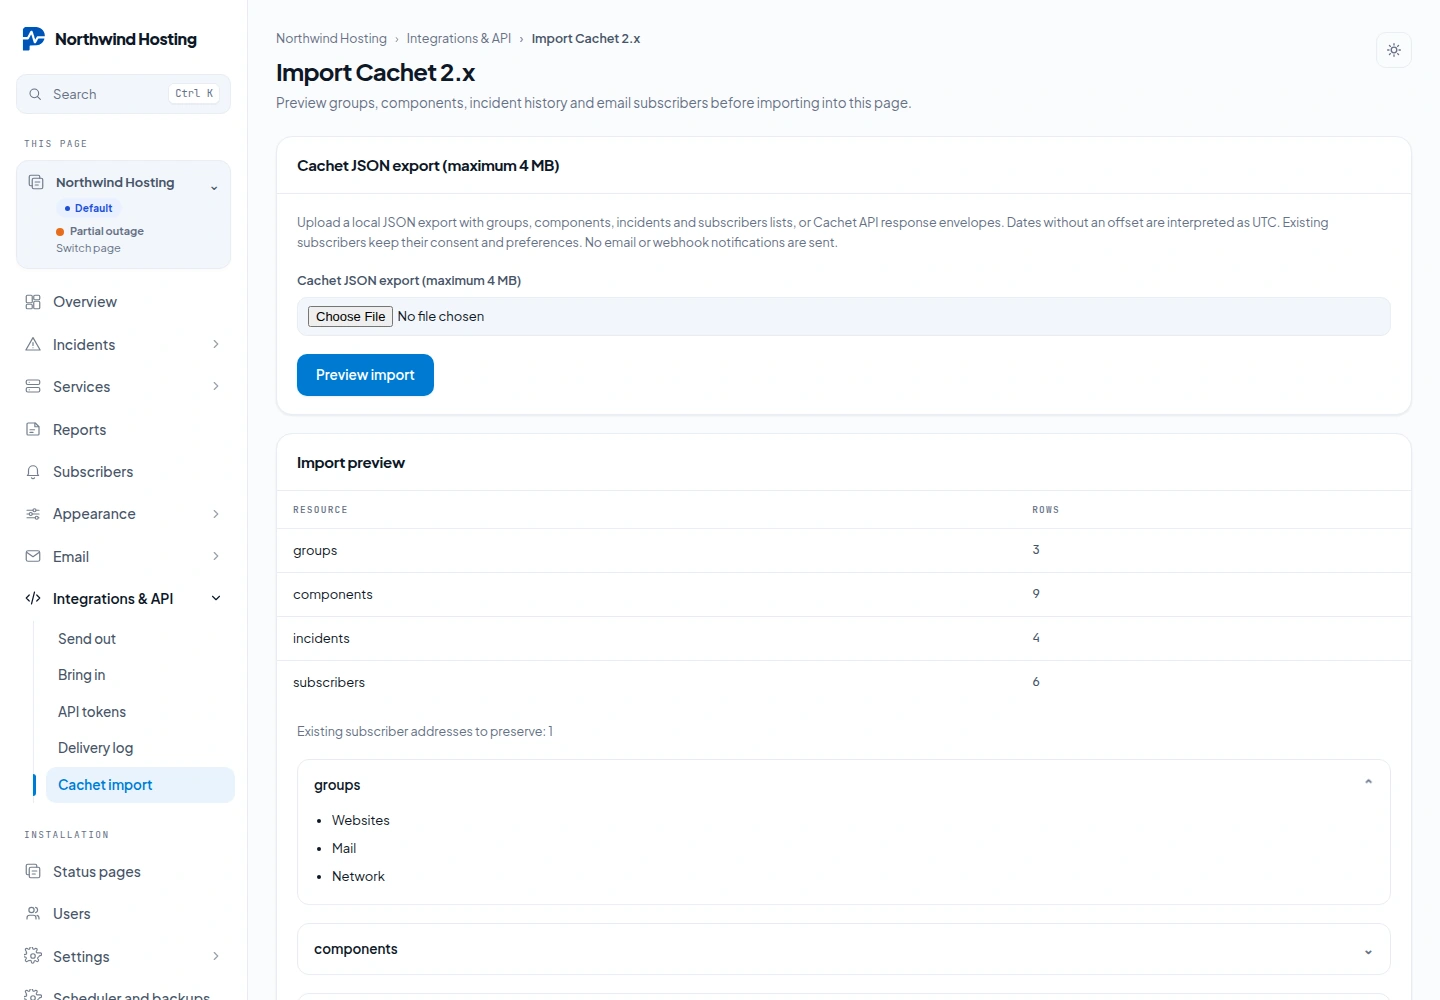
The importer brings the services, components, incident history and subscribers of a Cachet 2.x installation into one status page. You upload a JSON file, read a preview of what will be added, and only then import. Nothing is mailed and no webhook fires while it runs.
Make the export file
Pharos does not connect to your Cachet server. You collect the data yourself from the Cachet API and put it in one JSON file with up to four lists: groups (or component_groups), components, incidents and subscribers. Each one is a plain list, or the response of the Cachet API as it comes, with its {"data": [...]} wrapper. If Cachet returned several pages for a resource, join them into one list first.
{
  "groups": [{"id": 1, "name": "Website", "visible": 1}],
  "components": [{"id": 10, "name": "API", "group_id": 1, "status": 1}],
  "incidents": [{"id": 20, "name": "Past outage", "component_id": 10,
    "status": 4, "visible": 1, "message": "Recovered",
    "occurred_at": "2026-09-01T12:00:00Z", "updated_at": "2026-09-01T13:00:00Z",
    "updates": [{"status": 2, "message": "Cause found", "created_at": "2026-09-01T12:30:00Z"}]}],
  "subscribers": [{"id": 30, "email": "reader@example.com", "global": false,
    "verified_at": "2026-09-01", "subscriptions": [{"component_id": 10}]}]
}
The file may be 4 MB at most, with up to 1000 rows per list and 100 updates per incident.
Preview, then import
- Select the status page that should receive the data and open Integrations & API → Cachet import. The screen is there for administrators and for people with the Page admin role on that page.
- Choose the file and press Preview import. Pharos checks the whole file and shows how many rows each list has, with the names of the services, components and incidents.
- Read the preview. If it is right, press Import these records. The preview is kept for 20 minutes and can be used once; after that, upload the file again.
The import runs as one database transaction: it is applied completely or not at all.
What it does with your data
| In the file | In Pharos |
|---|---|
| Ids | Only used to connect rows inside the file. Everything gets a new id in Pharos, and a component or group that a row refers to must be in the same file. |
| Visibility | Kept for groups and incidents. A row that does not say it is visible is imported as not visible. |
| Dates | A date without an offset is read as UTC. |
| Subscribers | A verified date keeps the consent, so that address needs no new confirmation. An address that already exists on the page is left exactly as it is, opt outs and chosen services included. |
| Existing data | Nothing is overwritten. The import adds services, components and incidents next to what the page already has. |
| Not imported | Checks, settings and users. Cachet has no checks of its own; add them to the components afterwards. |
The same file cannot be imported twice into the same page: Pharos recognises it, also when the order of the rows or the notation of the dates differs, and says This export has already been imported into this page.
From the shell
The command reads a file on the server. Without --apply it only shows the counts and changes nothing:
php artisan pharos:cachet-import /home/you/cachet-export.json --page=2          # dry run
php artisan pharos:cachet-import /home/you/cachet-export.json --page=2 --apply  # import
--page is the id of the status page, the number in the admin address /admin/pages/2/overview. Leave it out to import into the first page.
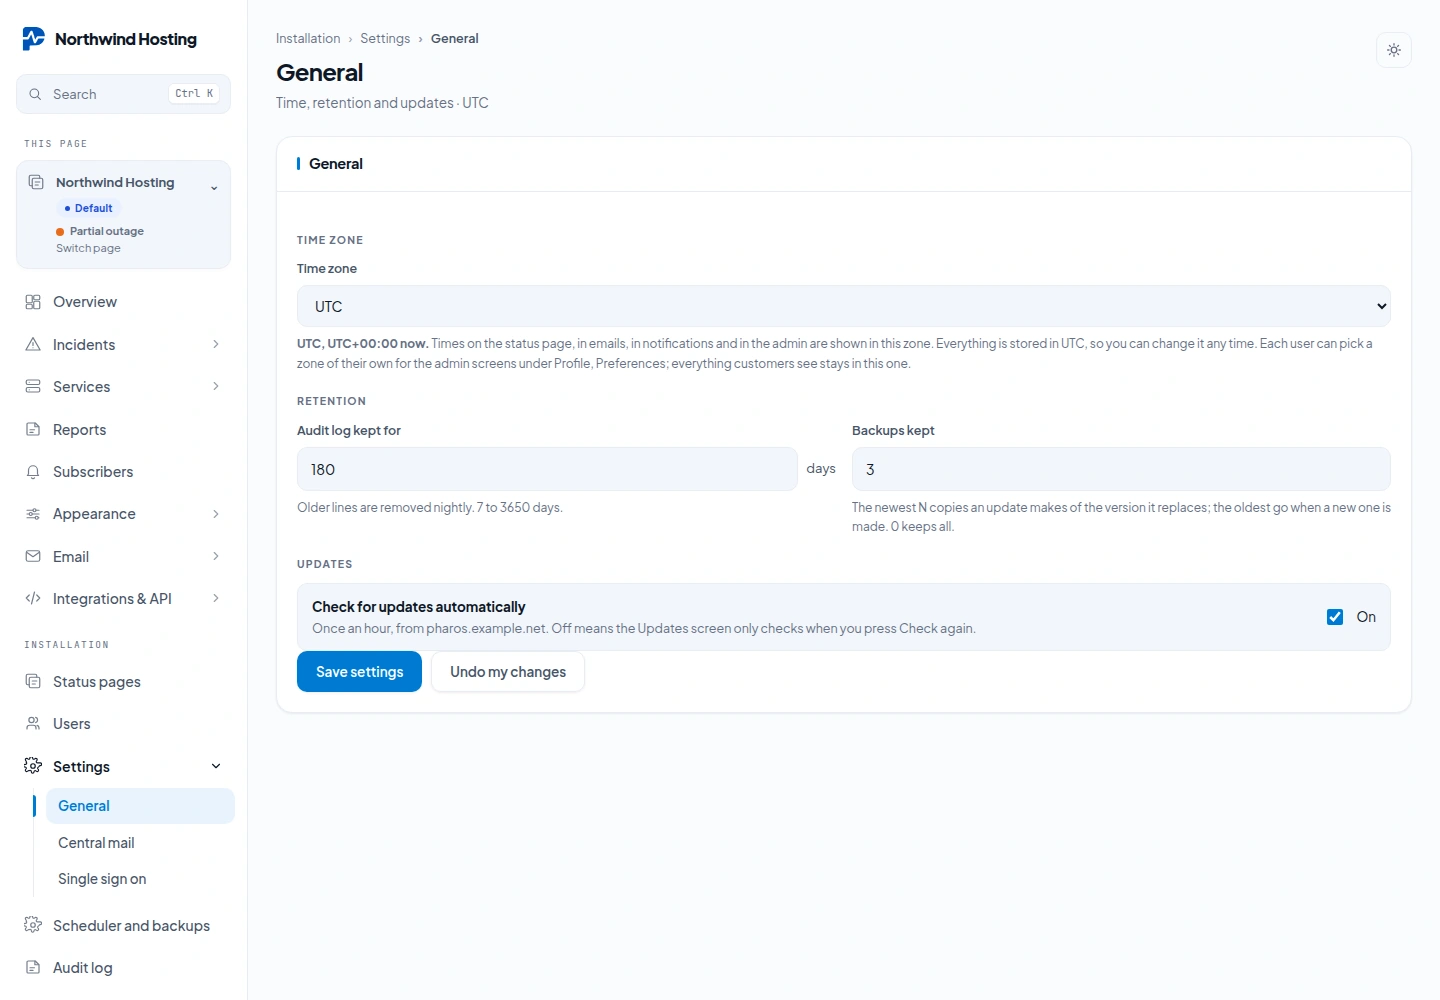
Time zone and retention
Under Admin → Settings → General:
- Time zone: pick any IANA zone (Europe/Amsterdam, America/New_York, Asia/Tokyo). Every timestamp on the public page, in the admin and in e-mails is shown in it. Everything is stored in UTC, so you can change the zone at any time and history does not move. Each user can also pick their own time zone for the admin screens under Profile; the public page and emails keep this one.
- Audit log kept for: 7 to 3650 days; older lines are pruned nightly.
- Backups kept: how many update snapshots to hold; see Updates & backups.
- Check for updates automatically: the hourly manifest check. Off means the Updates screen only looks when you press the button.
Settings → Central mail holds the MAIL_* connection for subscriber mail and a
Send test button; Settings → Single sign on holds the OpenID Connect fields covered under
Users, SSO & 2FA.
Next to Settings, under Installation, the screen Scheduler and backups holds Web cron and Remote backups. Language is not an installation setting: see Languages.
Languages
Pharos comes in four languages: English, Dutch, German and Spanish. There are two separate choices that do not affect each other: the language of the admin, which every account sets for itself, and the language of each public status page.
| Setting | Where | What it changes |
|---|---|---|
| Admin language | Profile, under Preferences, then Save preferences | Only your own admin screens. Colleagues keep their own choice. |
| Public page language | Appearance → Layout, then Save status page | That status page, the mails to its subscribers and the incidents that checks open by themselves. |
A new account and a new status page start in English. With several status pages, each page has its own language, so one installation can serve a Dutch page and a Spanish page side by side.
What follows the page language
- All fixed text on the status page, the incident pages and the monthly report, and the way dates are written.
- Status names, on the page and also in badges, the RSS feed and the widget.
- The built in wording of the mails to subscribers, and the messages a visitor sees when the subscribe form refuses an address.
- The title and the first update of an incident that a failing check opens.
What stays as you wrote it
- Names and descriptions of services and components.
- Incident and maintenance messages you write yourself.
- Mail templates you have edited. Only the built in wording is translated.
A page has one language. Visitors cannot switch it themselves, so pick the language most of your readers use. The API follows neither setting.
Branding and the Brand pack
Free: the name on the page and the accent colour, on 1 status page, with a “Powered by Pharos” footer credit.
Brand pack (€79, one time): your own logo for light and dark, your favicon, your logo in email, the footer credit removed, and the notification emails editable (subject and text, with tags). It keeps working forever. 1 status page.
Supported (€149 per year): the Brand pack included and kept, email support, and up to 5 status pages. Each page has its own components, subscribers, branding, email and integrations, and users get a role per page.
Commercial licence (from €599 per year): everything in Supported, unlimited status pages, and the AGPL publication duty lifted.
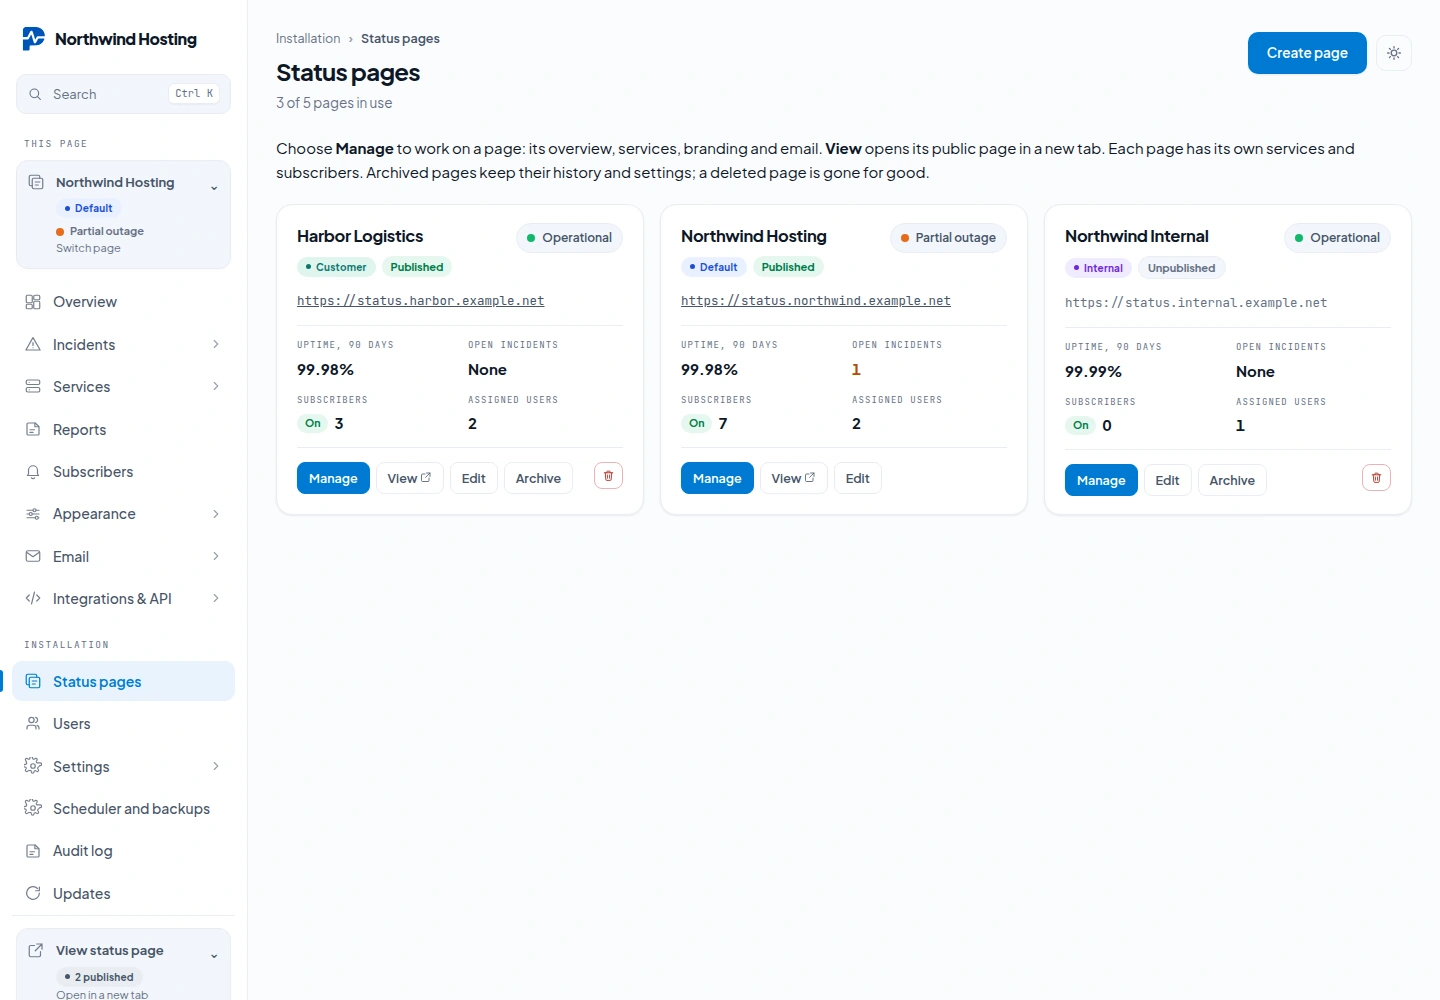
If a yearly key lapses, the branding stays and existing status pages keep running, but you cannot create or reactivate pages beyond one.
SVG uploads are refused on purpose. An SVG can carry script, and this file is served to every visitor of your status page.
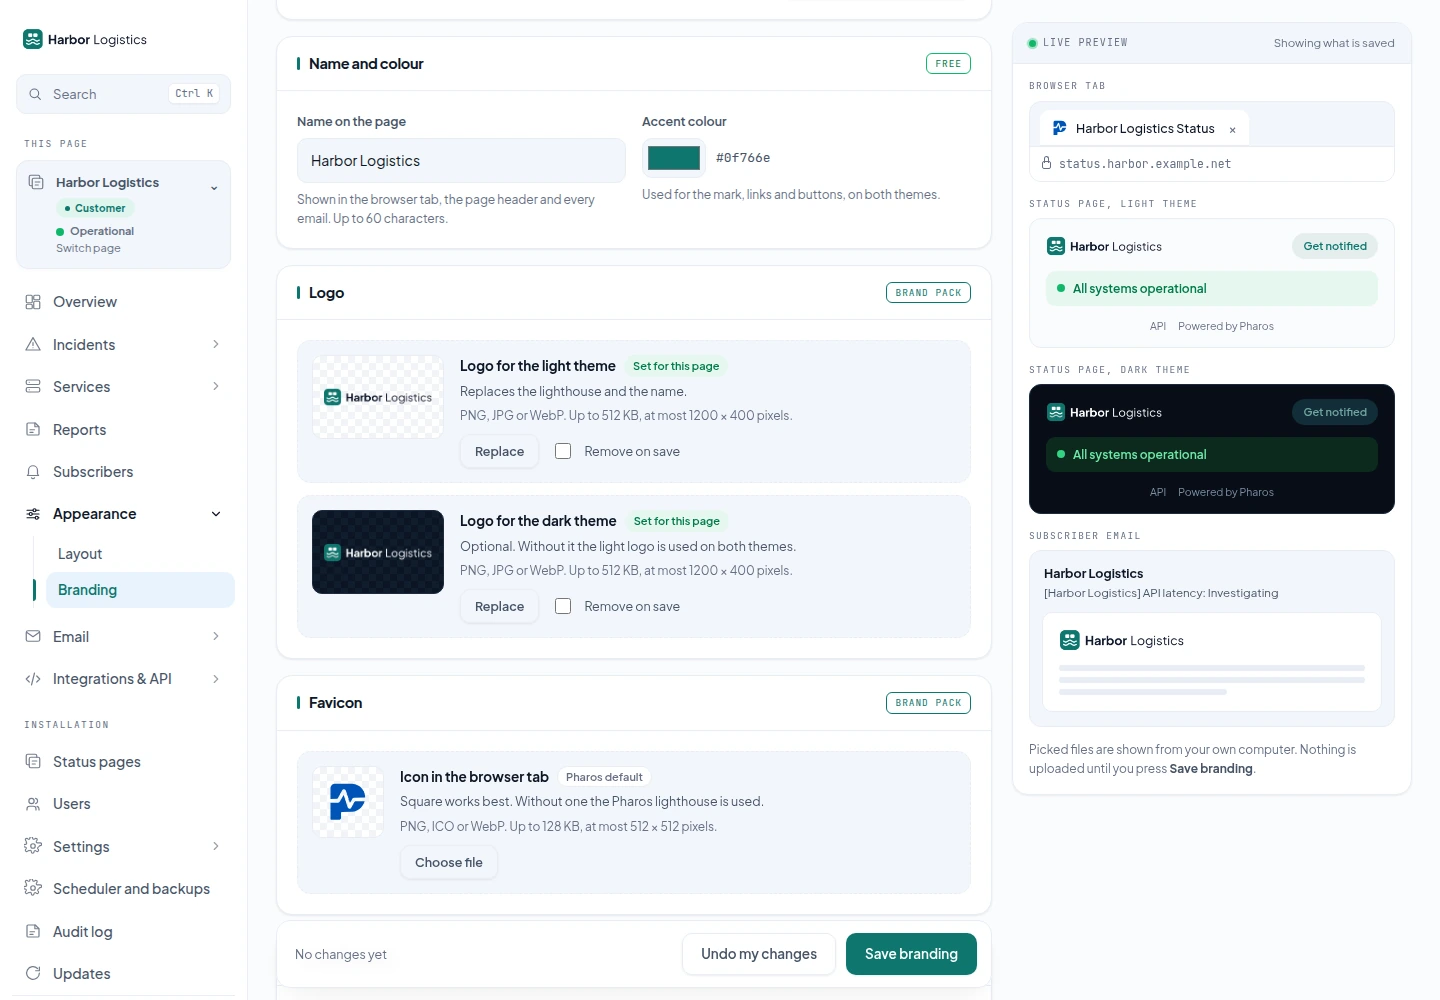
Branding is set per page under Appearance → Branding: the name and accent colour, the logos for light and dark, and the favicon, with a live preview of the browser tab, the page header in both themes and the email header. Nothing is uploaded until you press Save branding.
A key is an Ed25519 signature over a small payload, verified locally against the public key
in your .env. No network call is made at activation or afterwards, which means
a Pharos outage cannot break your branding, activation works on a host with no outbound HTTP,
and the licence keeps working whether or not you renew. Renewing buys updates and support,
not permission to run.
Updates
php artisan pharos:update --check   # what is available
php artisan pharos:update           # install it
Pharos fetches a signed manifest once an hour. It carries
purpose: pharos-release, which is why a licence key can never be replayed as an
update manifest even though the same key signs both. A release server that cannot be reached
reads as no news, never as an error on a status page.
| Install | How it updates |
|---|---|
| PHP host | The app downloads the release, checks it against the signed checksum, copies the current version into storage/app/backups, replaces its files and migrates. |
| Docker | The host owns the image. The app shows what the host reported and drops a trigger file when you press the button. |
| Neither | The directory is not writable, so update over SSH. |
Your .env, database and uploads are never touched, and a downgrade is refused:
an older build may not survive migrations the current one already ran.
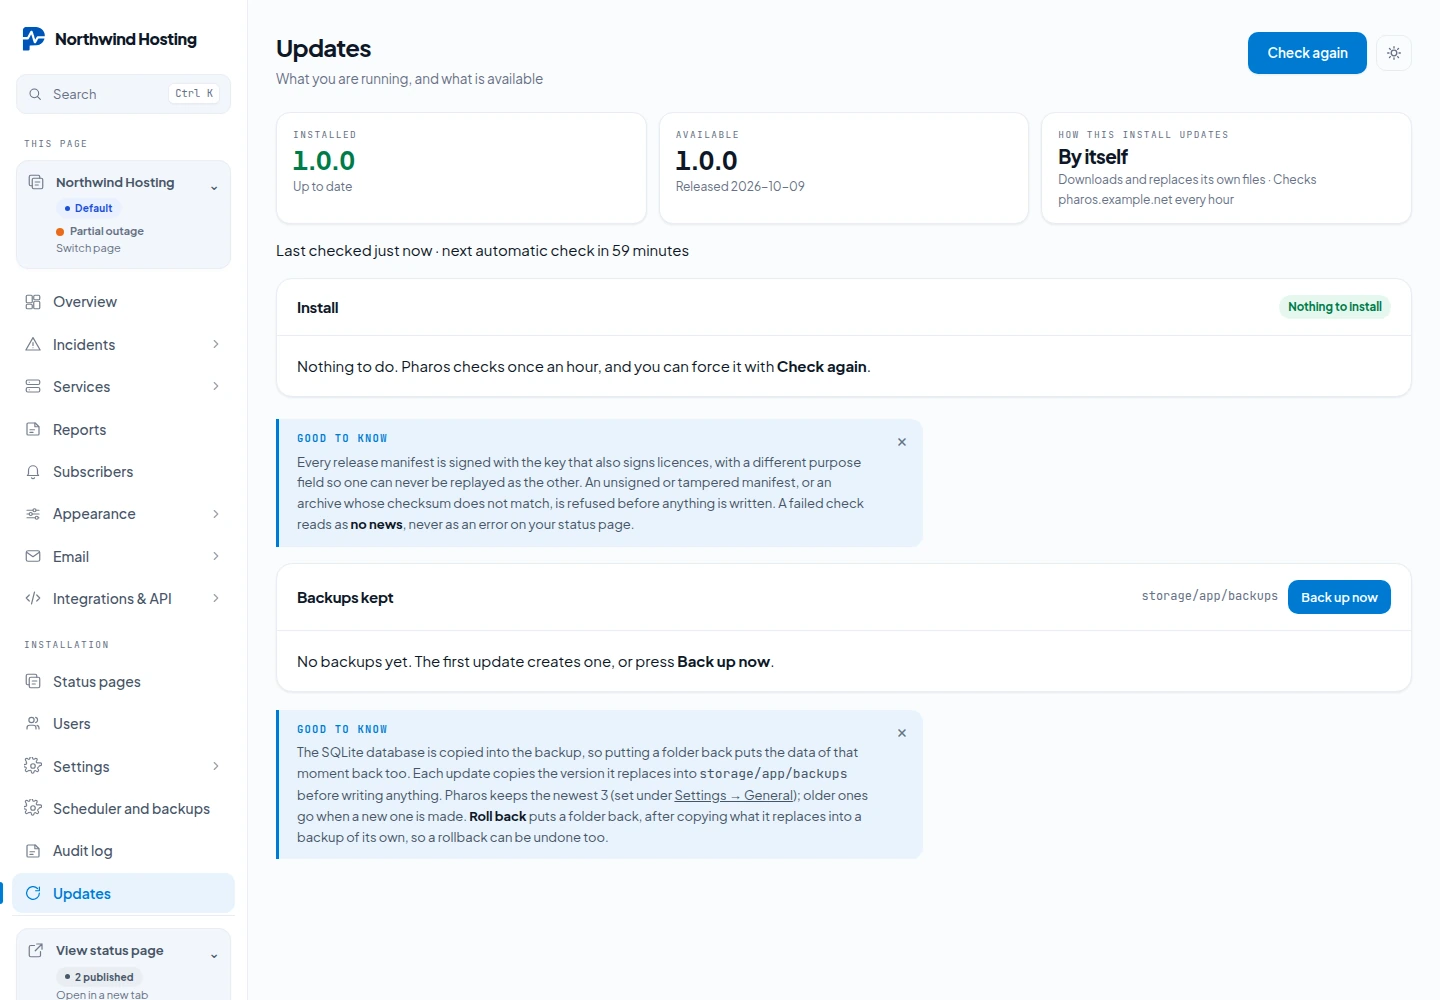
Backups, rollback and retention
Before it replaces anything, Pharos snapshots the version it is about to overwrite: the code, the
installed vendor/ tree, and, on SQLite, a consistent copy of the database taken with
VACUUM INTO so it is safe to copy a live file. On MySQL the files are captured but the
database is not, so keep your own database backups there.
The same snapshots are yours to make and manage under Updates:
- Back up now: take a snapshot by hand before a manual change. Installing a release, making a backup and rolling back each open a dialog that shows every step as it happens (download, checksum, unpack, backup, install, migrations) with a live file count.
- Download: pull any snapshot down as a single
.zip. - Roll back: put a kept snapshot back over the running install. What it replaces is itself backed up first, so a rollback is never a one-way door. Because the database can come back with it, you are signed out and sign in again with the password you had at the time of that snapshot.
- Delete: remove one you no longer want.
How many are kept is the Backups kept setting under Settings → General:
the newest N are held and the oldest is removed when a new one is made. 0 keeps every snapshot.
The one you would roll back to is never pruned out from under you.
These snapshots stay on the same server as Pharos. They protect you from a bad update, not from losing the server. For a daily copy somewhere else, see Remote backups.
Updating to 1.0
1.0 installs like any other release: from the Updates screen, with php artisan pharos:update, or by pulling the new image on Docker. The database migrations run by themselves. After a manual update (unpacking the zip or a git pull by hand), run php artisan migrate --force yourself. This is what changes on an existing installation:
- Uptime for reported services starts counting. Services fed through the API or Uptime Kuma get uptime from the moment of the update. Earlier days stay grey. See Uptime.
- Services with the old source "api" now read "webhook". Nothing else about them changes.
- Raw check results older than 40 days are removed, once a day and in small batches. The uptime figures do not change.
- The log is one file per day,
storage/logs/laravel-YYYY-MM-DD.log, and the last 14 days are kept. An existinglaravel.logstays where it is and can be deleted. Set LOG_DAILY_DAYS to keep more or fewer days, or LOG_STACK=single for one file as before. - Subscribers keep receiving everything. Choosing services is something they do themselves, see Service subscriptions.
- The cron line does more, but it stays the same line. See The one cron line.
An update never touches .env, so the settings that came with 1.0 are not added for you. All of them are optional. Add the ones you need by hand:
| Setting | For |
|---|---|
PHAROS_WEB_CRON_TOKEN | Web cron |
PHAROS_PROBE_HUB, PHAROS_PROBE_TOKEN | An installation that works as a probe location |
PHAROS_WEBAUTHN_ORIGIN | Passkeys, when APP_URL has a folder in it |
PHAROS_CHECK_RESULT_DAYS | How long raw check results are kept, 40 by default |
LOG_DAILY_DAYS, LOG_STACK | How many daily log files are kept, 14 by default, or one single file |
Remote backups
A remote backup sends a complete copy of your installation to storage of your own, once a day: an S3 bucket or an SFTP server. After each upload Pharos downloads the file again and compares it with the original, and only then calls it a success. Open Scheduler and backups under Installation. Only administrators of the installation can add, run or remove a destination.
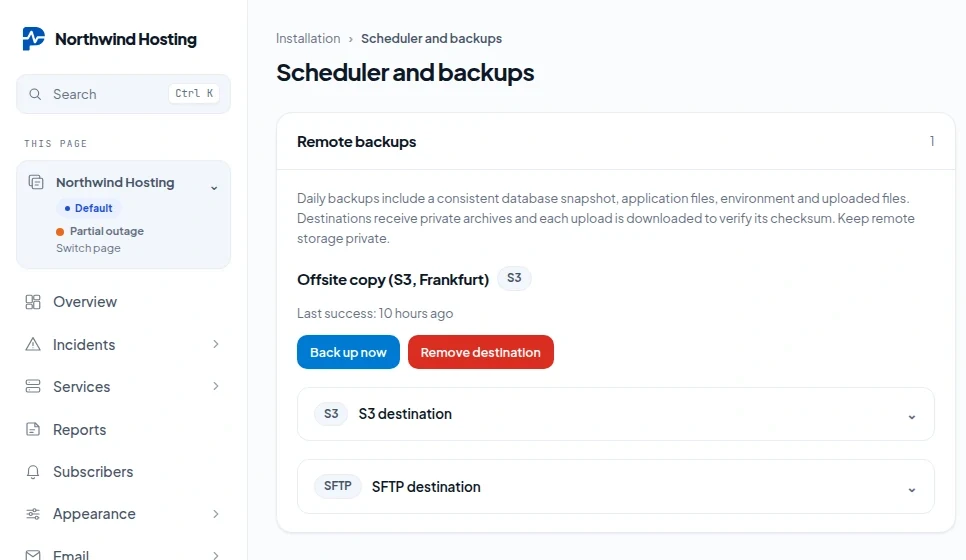
What is in a backup
One zip file per run, named pharos- with the date, the time and a random part.
| In the archive | Detail |
|---|---|
| The database | On SQLite a consistent copy, checked for integrity, as database/database.sqlite. On MySQL a dump made with mysqldump, as database/database.sql. |
The application and .env | The code and your configuration, which includes APP_KEY. |
| Uploads and public files | Under public/, also when your public folder lives outside the application folder, as it does after the web installer. |
| Two notes | BACKUP-LAYOUT.json records where the public files came from. BACKUP-README.txt holds the restore steps. |
| Left out | vendor/, git data, caches, sessions, logs and the snapshots under Updates. |
Keep the storage private. The archive holds account data and your .env with its passwords and APP_KEY. Anyone who can read the bucket or the folder can read all of it.
Add a destination
Open S3 destination or SFTP destination, fill in the fields and press Add destination.
| S3 field | What to enter |
|---|---|
| Name | Your own label for the destination. |
| HTTPS endpoint (optional for AWS) | The address of an S3 compatible service. Leave it empty for Amazon S3. It must be HTTPS, without a user name, query or fragment in it. |
| Region, Bucket | As your provider names them. |
| Folder prefix | Optional. A folder inside the bucket. |
| Access key, Secret key | A key that may write and read objects in that bucket. |
| SFTP field | What to enter |
|---|---|
| Name | Your own label for the destination. |
| Host, Port | The server and its SSH port, 22 by default. |
| Username, Password | The account to sign in with. Sign in is by password; there is no field for a key file. |
| Verified server host fingerprint | The complete SHA256 or SHA512 fingerprint of the server's host key. Required. |
| Remote directory | An absolute path on the server, /backups by default. |
- The fingerprint is what proves you are talking to your own server. Pharos accepts it as OpenSSH prints it (
SHA256:followed by the base64 value) or as hexadecimal, with or without colons. Get it from the server itself or from your provider, not from a first connection you cannot check. Without a valid fingerprint Pharos does not connect. - Allow this destination on a private network: tick this when the storage has a private address, for example a server on your own network. Without it Pharos only connects to public addresses. This machine itself and link local addresses are refused either way.
- Keys and passwords are stored encrypted and are never shown again. To change a destination, remove it and add it again.
- An installation can have up to 10 destinations.
When it runs
- Every day at 02:45 UTC, from the cron line, to every destination. The command behind it is
php artisan pharos:backup-remote. - Back up now on a destination does the same at once.
- Each destination shows Last success. After a failure it shows one short line and no details: check the address, the credentials and whether the server can reach the storage.
- A delivery gets five minutes in total. A very large installation on a slow line may not fit in that.
- Pharos never deletes old backups at the destination. Set a lifecycle rule on the bucket or clean the folder yourself, or the storage fills up.
On SQLite the backup needs PHP's sqlite3 and zip extensions. On MySQL it needs the mysqldump program on the server, and tables of a transactional type such as InnoDB for a consistent dump. After the first run, open the archive and check that the database is in it.
Restore
- Stop the cron line, so nothing writes while you restore.
- Put the application files and
.envback. Keep the original APP_KEY: without it the stored destination credentials and the two factor secrets cannot be read. - Put the contents of
public/from the archive into the document root the site uses now.BACKUP-LAYOUT.jsontells you where they came from. - Put
database/database.sqliteback, or importdatabase/database.sqlinto MySQL. vendor/is not in the archive. Install the dependencies fromcomposer.lockwithcomposer install --no-dev.- Make sure
storage/andbootstrap/cache/exist and are writable, runphp artisan storage:link, and start the cron line again.
Try a restore on a separate installation before you rely on it.
Web cron
Pharos needs its scheduler to run every minute, and normal cron is the way to do that. Some hosts offer no cron, or not every minute. There an outside service can start the scheduler with an HTTPS request. It is a fallback: use real cron wherever you have it.
Switch it on
- Make a random token of at least 32 characters, for example with
openssl rand -hex 32, and put it in.env:PHAROS_WEB_CRON_TOKEN=<your token>An installation made with the web installer picks the change up by itself. If the configuration is cached, as after a manual install, runphp artisan optimize:clear. - Open Scheduler and backups under Installation. Only administrators see it. The card Web scheduler fallback says Credential configured once Pharos reads the token. The token itself is never shown.
- Tick Enable web scheduler and press Save. Without a token of 32 characters or more the switch refuses to go on.
- Let an outside scheduler call one of the two addresses on the card every minute, with the token in a header.
POST https://status.example.com/api/cron
GET  https://status.example.com/cron/run

Authorization: Bearer <your token>
curl -fsS -X POST https://status.example.com/api/cron \
  -H "Authorization: Bearer $PHAROS_WEB_CRON_TOKEN"
The token only works in the header. Pharos does not read it from the address, because addresses end up in access logs. A service that can only call a plain URL, with nowhere to set an Authorization header, cannot be used.
What the call answers
| Answer | Meaning |
|---|---|
200 with {"ok":true} | The scheduler ran. |
401 | The token is missing, wrong, or shorter than 32 characters in .env. |
404 | The switch is off. |
409 | An earlier web call is still running. Nothing is lost; the next call picks up. |
429 | More than 2 calls in a minute. |
503 | The scheduler ran but reported a failure. Look in the log. |
To stop it, untick the switch, or change the token in .env. Pharos shows the same scheduler warning in the admin as with cron when no run arrives, so you notice when the outside service stops calling.
Users, SSO and two-factor
There are two kinds of account. Admin manages users, updates, API tokens, branding, mail templates and the audit log on every page; user works on the pages assigned to them, with a role per page. The first account is an admin. Login is throttled at five attempts per email and IP with a five-minute lockout. Passwords are at least twelve characters.
You cannot delete the account you are signed in with, and you cannot delete the last account: locking everyone out of a self-hosted install is not recoverable through the interface. Forgot password? on the sign in screen mails a link to set a new password, which needs working mail settings. Without mail, recover from the shell:
php artisan pharos:user you@example.com --password='a-new-long-password'
Roles per status page
Administrators see every page. Everyone else gets a role on each page they need: Read only views the page's screens and delivery history without check targets or integration credentials; Editor manages components, services, incidents, maintenance, subscribers and destinations; Page admin adds that page's branding, email, mail templates and API tokens. Installation settings, licences, users and creating or archiving pages stay with administrators. Lowering or removing a role takes effect at once, also in open sessions.
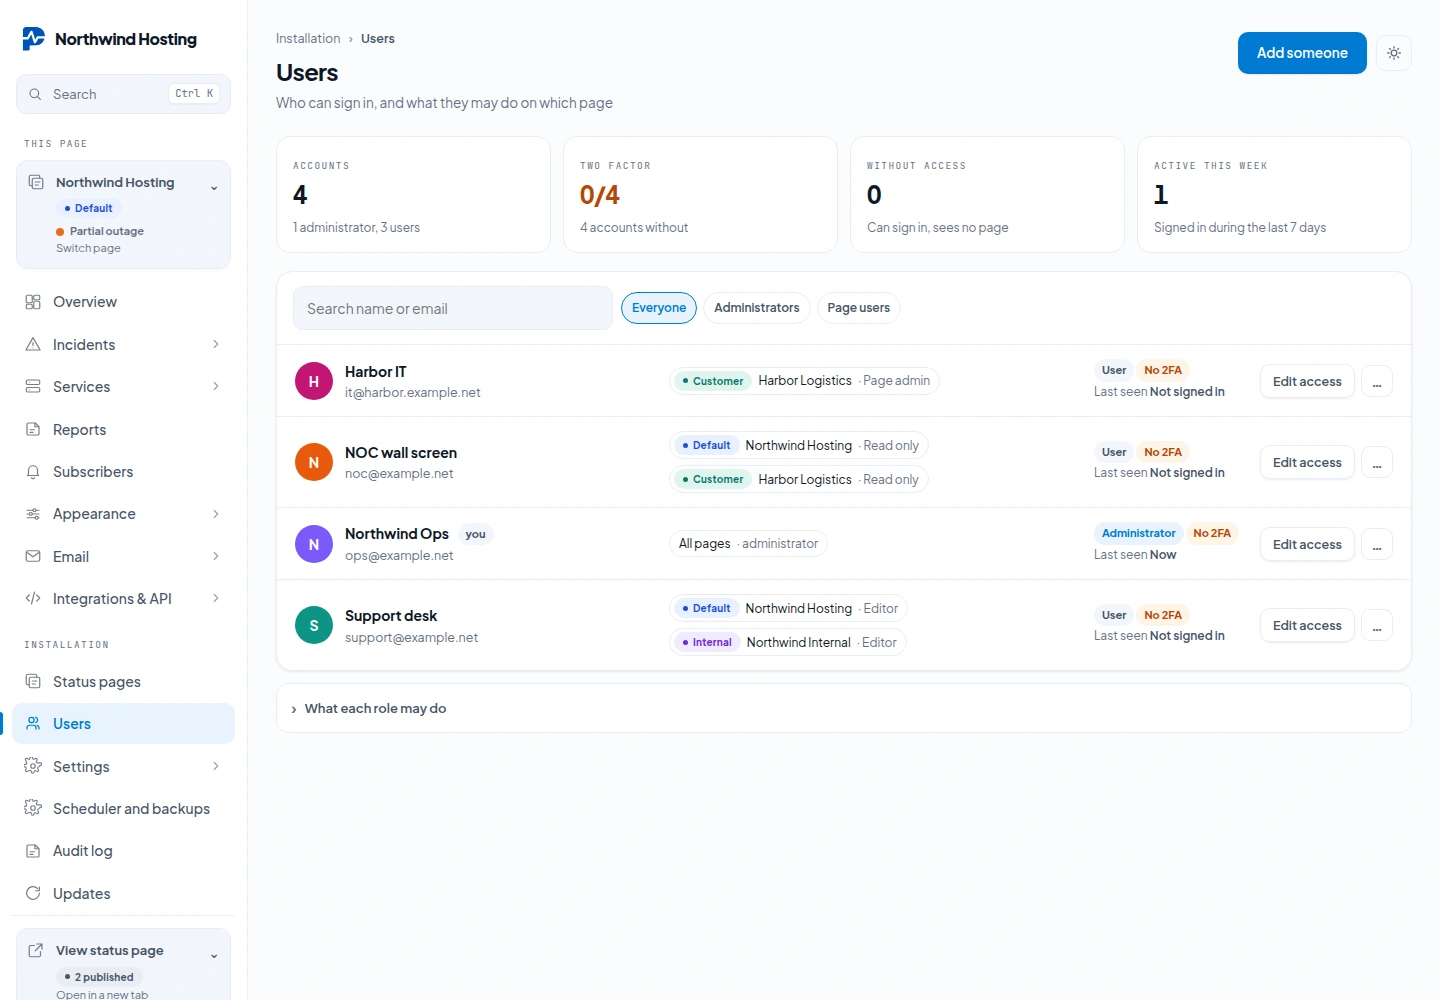
Two-factor
Each user turns on TOTP two-factor for their own account under Profile: scan the QR code with any
authenticator app, confirm one code, and it is on. It is asked for at every sign-in afterwards, including a
sign-in through single sign-on, so a second door never skips the gate. Lost the device? Turn it off for that
account from the shell with php artisan pharos:2fa:disable you@example.com.
Switching it on also gives you ten recovery codes, shown once. Each one signs you in a single time when the authenticator app is not to hand.
A code from the app works once. Enter the same code a second time, for example because you signed out and straight back in, and Pharos answers: That code has already been used. Wait for the next one. Nothing is wrong with your app or your clock. Wait until the app shows a new code, at most 30 seconds, and enter that one. A code that is simply wrong gets a different answer: That code did not match.
Passkeys are a separate way to sign in. They do not replace two factor: an account with two factor on is asked for its code after a passkey too.
Single sign-on (OpenID Connect)
Under Settings → Single sign on you can point Pharos at any OIDC provider: Authentik, Keycloak, Google Workspace, Entra ID. Fill in the issuer URL, client id and secret, register the redirect URI it shows you, and a Sign in with … button appears on the login screen.
People sign in, they do not appear. Someone signing in through your provider needs an account here already, matched on their verified e-mail address; an address nobody here uses is refused, not turned into a new account. Password sign-in keeps working, so a provider that is down never locks you out. The switch is tested the moment you save it; a provider that cannot be reached will not switch on.
Passkeys
A passkey lets you sign in with your device or a security key instead of typing your email and password. Every account manages its own passkeys under Profile, in the card Passkeys. Password sign in keeps working next to it.
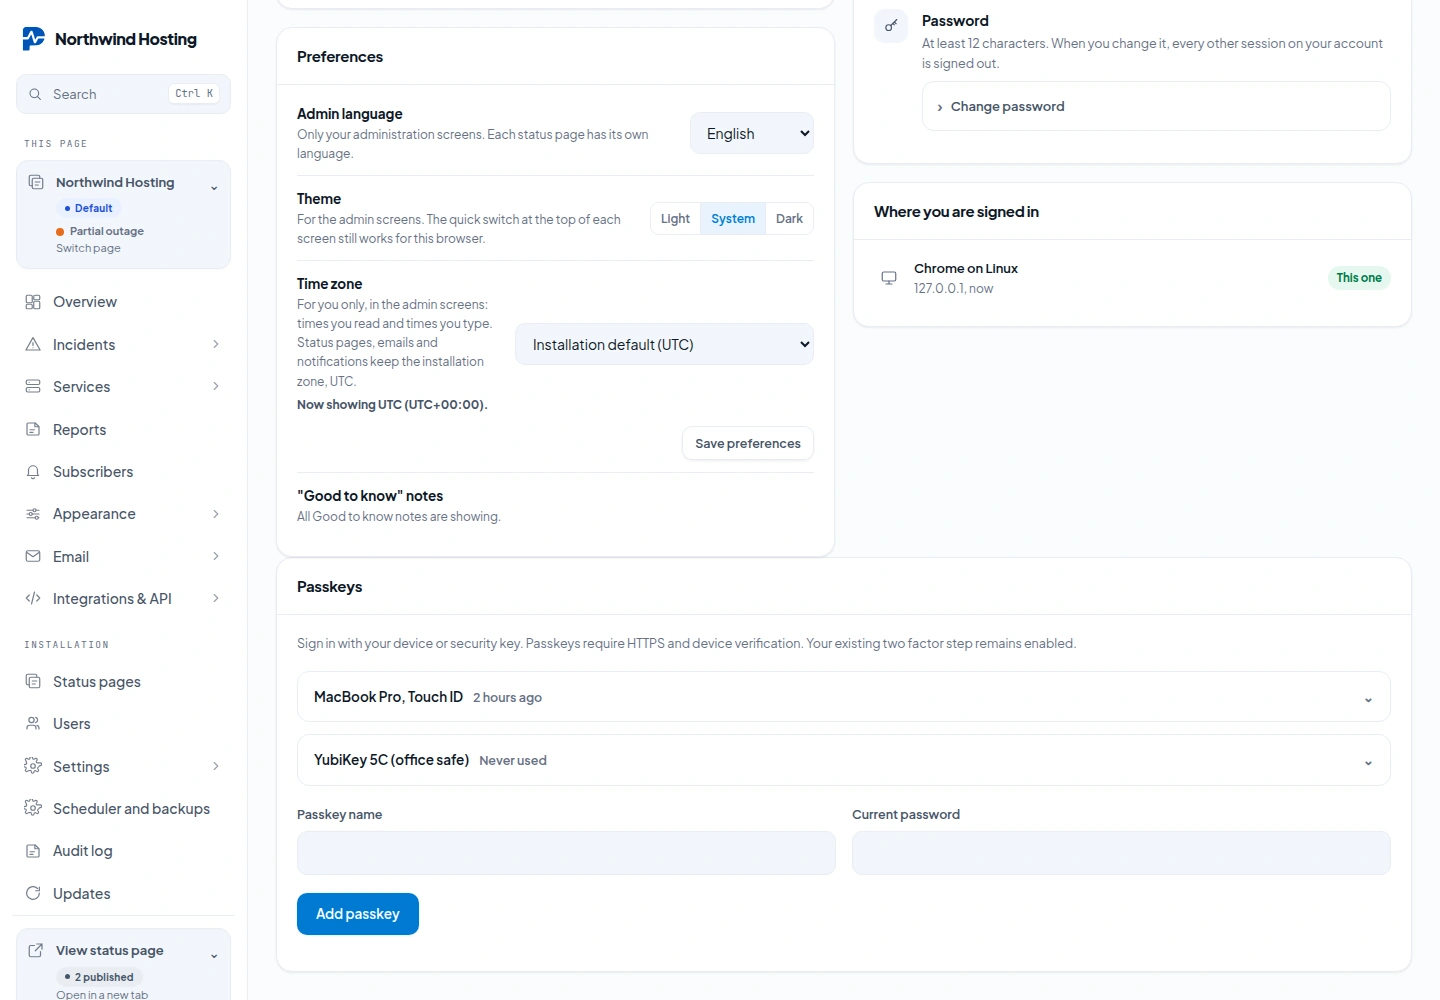
Passkeys need an HTTPS hostname. They only work when you open the admin on an https:// address with a name, such as https://status.example.com. They do not work on an IP address, not even with HTTPS, and they do not work over plain HTTP. On plain HTTP the buttons stay off and Pharos says: Passkeys are unavailable here. Use a supported browser on the configured HTTPS hostname.
Add a passkey
- Open Profile and find the card Passkeys.
- Type a Passkey name you will recognise, such as the device it lives on, and your Current password.
- Press Add passkey. The browser asks you to confirm with the device or the key. The passkey then appears in the list, with when it was last used.
To remove one, open it in the list, type your Current password and press Remove passkey. An account can hold up to 10 passkeys.
Adding or removing a passkey always asks for the account's own Pharos password. That is also true when you normally sign in through single sign on: the password of your identity provider does not work here. If you do not know your Pharos password, set one first with Forgot password? on the sign in screen.
Sign in with a passkey
On the sign in screen, press Sign in with a passkey. You do not type an email address: the browser offers the passkeys it holds for this site, and the device asks you to confirm.
- If your account has two factor on, Pharos asks for the code after the passkey, as it does after a password.
- A passkey does not count as two factor. If an administrator requires two factor for your account, you still have to set that up.
- Keep your password, and your recovery codes if you use two factor. A lost device should never be your only way in.
For the administrator of the installation
Usually there is nothing to set. A passkey is tied to the address of the admin, and Pharos takes that address from APP_URL. So APP_URL must be the exact HTTPS address people open, name and port included.
APP_URL=https://example.com/status
# only needed when APP_URL has a folder in it, as it does here
PHAROS_WEBAUTHN_ORIGIN=https://example.com
- PHAROS_WEBAUTHN_ORIGIN is the scheme, the hostname and, if you use one, the port. No folder and nothing after it. When Pharos runs in a folder, as in the example, set it to the address without the folder. Without a folder you can leave the setting out.
- A passkey belongs to the hostname it was made on. Move the admin to another hostname and the existing passkeys stop working: everyone adds new ones on the new address. Passwords are not affected.
- Adding and removing a passkey is written to the audit log.
Audit log
Every change made from the admin or through the API is written to Admin → Audit log: who did it, when, from which IP, and what changed. The automatic checks are not logged there: nobody made them, and they would bury the human actions that matter. Filter by person or by what was touched, and Download CSV exports exactly what the filter shows (with a UTF-8 marker so Excel reads accented names correctly).
It is a record, not a backup: nothing here is edited or deleted from the interface, and lines are pruned once they pass the retention window set under Settings → General. Anyone who can sign in can read it, so treat it as the list of your components, integrations and colleagues' addresses that it is.
Troubleshooting
Checks are not running
- Prove the runner works:
php artisan pharos:check --force. If that works but nothing happens on its own, the scheduler is the problem. - Prove the scheduler fires:
php artisan schedule:run, then check the cron line uses an absolute path and the right PHP binary. On Docker,docker compose ps; the scheduler must be up. - Check the component is enabled. Disabled components are skipped entirely.
- If every HTTP check says
No response, your host almost certainly hasallow_url_fopenoff or blocks outbound HTTP. - Look in the log of today,
storage/logs/laravel-YYYY-MM-DD.log. Pharos writes one file per day and keeps 14 days. The shipped log level iswarning. An installation from before 1.0 may still have an oldlaravel.lognext to them; it is no longer written to. - No cron on the host at all? See Web cron.
A component is stuck down
- Run
php artisan pharos:check --forceand read the message beside it. - For heartbeats, call the URL by hand. A 404 means the token is wrong; a 200 means Pharos is fine and your cron is not calling it.
- Check nothing else owns it. A workflow that also sets this component will fight the built-in check every minute, so pick one owner.
A DNS or keyword check fails while the site works
- Read the message with
php artisan pharos:check --force.Expected text is missing,Expected DNS record is missingandDNS lookup failedeach point at a different cause. - Expected text is compared exactly, capitals included, and is not looked for behind a redirect. Check the address serves the page itself and that the response is smaller than 1 MiB.
- For DNS, compare with what the server itself resolves. An MX value is the priority, a space and the hostname. A TXT value must match the whole record.
A component sits on Degraded performance
- Open the component and read the date after TLS certificate expires. With 3 days or less left, Pharos sets the component to Degraded performance. Renew the certificate and the next healthy run sets the component back.
- If the check has probe locations, open Services → Probe locations. A line with
missing or stalemeans too few locations reported in time to decide. - On the remote installation, run
php artisan pharos:probe-remoteby hand. It tells you when the hub address or the credential is refused. Check there that the cron line runs and that the hub address starts withhttps://.
The admin looks stale
Admin pages already send no-store, so the browser cannot serve you a screen the
server never rendered. If it persists, something in front of Pharos is caching, so exclude
/admin/* from it. After editing .env, run
php artisan optimize:clear.
Mail is not sending
- Open Settings → Central mail and press Send test. The result tells you whether the connection works before any subscriber is involved.
- What is saved there wins; anything left blank falls back to the
MAIL_*lines in.env. The screen shows the effective sender and host it will use. - Subscriber mail is sent from the cron line, so confirm the scheduler is firing (see above); a paused scheduler means no confirmation and no incident mail.
- Nothing arrives but the test passes? Check the address is confirmed under Subscribers; an unconfirmed address is never mailed.
- One subscriber misses an incident that others got? That address may follow only some services. A subscriber who chose services is not mailed about the others. See Service subscriptions.
Signing in
- "That code has already been used. Wait for the next one." A two factor code works once. Wait for the app to show a new code and enter that.
- The passkey button is greyed out. You are on plain HTTP, or the browser has no passkey support. Passkeys need an HTTPS hostname, see Passkeys.
- "Passkey sign in failed" on an address that is an IP, or after the hostname changed. A passkey only works on the hostname it was made on, and never on an IP address. Sign in with your password.
- Adding a passkey refuses your password. It wants the password of the Pharos account, not the one of your single sign on provider.
Web cron and remote backups
- The web cron call answers 404. The switch Enable web scheduler is off.
- It answers 401. The header is missing or the token differs from PHAROS_WEB_CRON_TOKEN. A token in the address is not read.
- A remote backup fails. The screen shows one short line on purpose. Check the credentials, and for SFTP the fingerprint. A storage server with a private address needs Allow this destination on a private network.
- The PDF report does not download. Check that PHP's
domextension is loaded.
Written against the shipping source. If something here does not match what you see, the source is right and this page is wrong. Please say so.