
Monthly uptime reports
Updated 2026-10-09 · Pharos 1.0.0
Pharos turns the uptime it recorded into a report per calendar month: one row per component, in the column Service, on screen, as CSV or as PDF. Open Reports in the admin of the page, pick a month, press Show report, and use Download CSV or Download PDF.
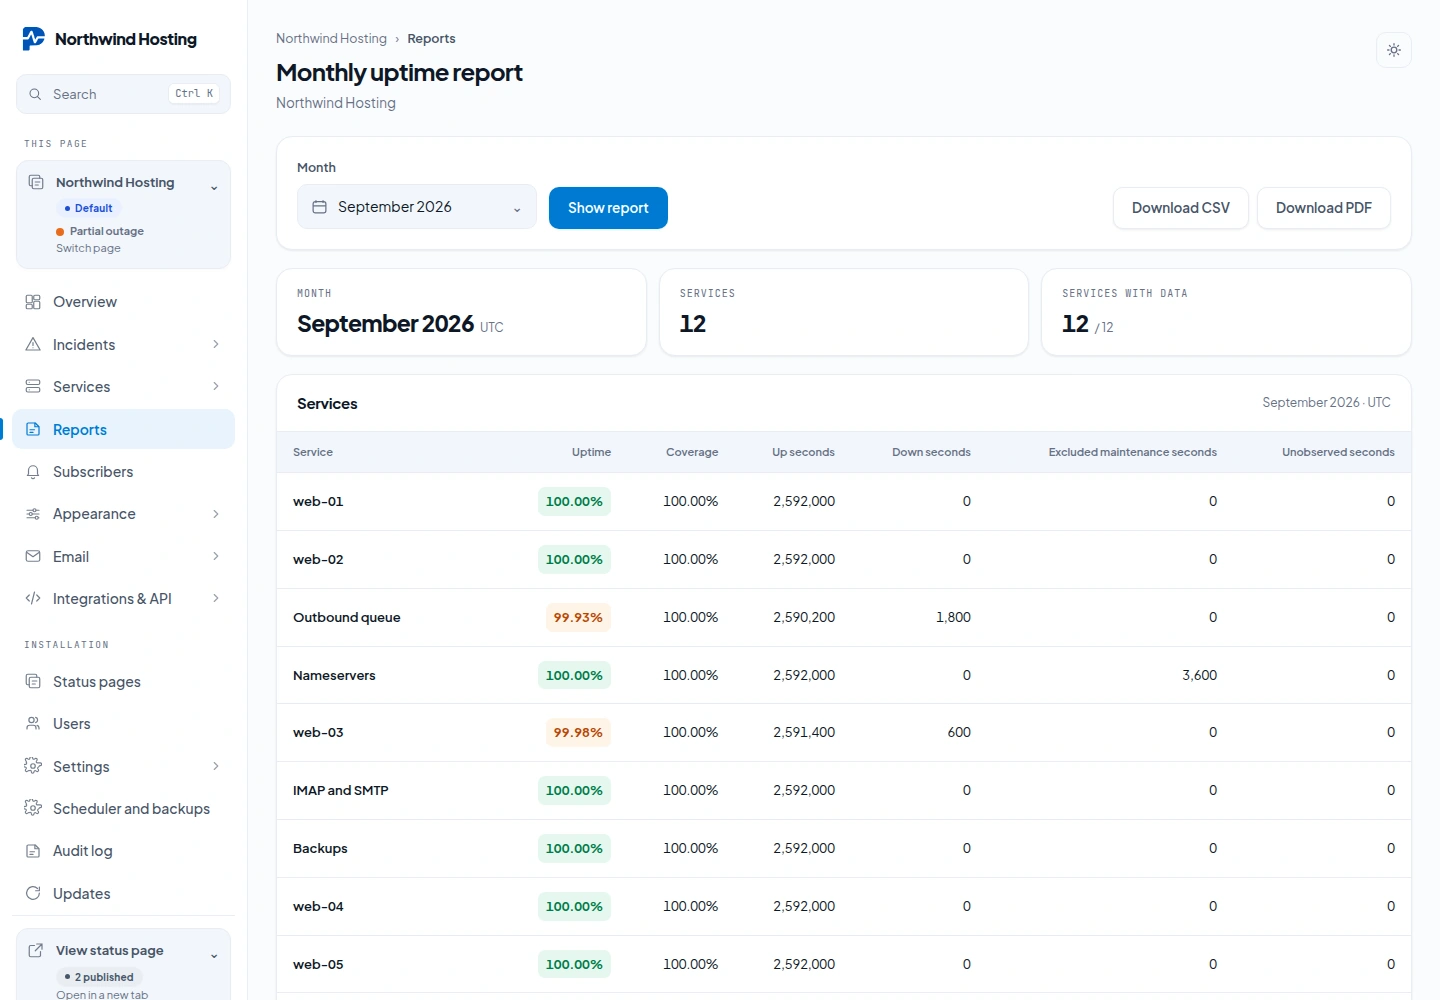
| Column | Meaning |
|---|---|
| Uptime | Up seconds as a share of the seconds that were measured. No data when nothing was measured. |
| Coverage | How much of the month was measured at all, after maintenance is taken out. |
| Up seconds, Down seconds | The measured time, from the daily uptime rows. |
| Excluded maintenance seconds | Time inside maintenance windows that actually started. Overlapping windows count once. |
| Unobserved seconds | Time in the month that was neither measured nor maintenance. |
Months are UTC calendar months. The daily rows are stored per UTC day, so a report cannot follow your local midnight. Do not read it as an SLA figure in local time. Time that was not measured is never counted as up: it lowers the coverage, not the uptime.
The public report
Visitors get the same report at /reports, with /reports.csv and /reports.pdf for the downloads. The footer of the status page links to it as Monthly reports. Add ?month=2026-09 for a given month, from January 2000 up to the current one. The current month stops at the present moment.
https://status.example.com/reports?month=2026-09
https://status.example.com/reports.csv?month=2026-09
https://status.example.com/reports.pdf?month=2026-09
- The public report lists what visitors can see on the page. The report in the admin also lists hidden services and disabled components.
- People with the Read only role on the page can open and download the report in the admin.
- On a second status page the public address is
/status/{slug}/reports.
Limits
- A report covers up to 500 components and 2000 maintenance windows per page per month. Above that Pharos refuses the report with a message, and leaves nothing out silently. Split a very large page.
- Days recorded before 1.0 may still include time that fell inside maintenance. Those totals are kept as they are, and the report says so.
- A service whose status is set by hand has no measurements, so it shows No data.
- The PDF needs PHP's
domextension next tombstring. The installers do not check fordom, so enable it if the PDF download fails. - Report pages are limited to 15 requests per minute per visitor.