Uptime and what the bar means
Updated 2026-10-22 · Pharos 1.0.1
Every check run adds the time since the previous run, at most one interval, to that day's
up_seconds or down_seconds, one row per component per day. That
is why a 90-day bar costs 90 rows rather than every raw result.
Who gets uptime
| Service is | Uptime comes from | Shown as |
|---|---|---|
| Checked by Pharos | Each run of its HTTP, TCP, DNS or heartbeat check | A percentage per day |
| Set from outside (API, Uptime Kuma, upstream) | The status it was last told, counted every minute | A percentage per day, marked reported in the admin |
| Set by hand | Nothing | Not measured |
Until 1.0 only the checks Pharos runs itself produced uptime, so a service fed through the API (Zabbix, n8n, a script) or by Uptime Kuma showed grey cells for ever. Now Pharos counts, every minute, the time such a service spends in the status that was reported for it:
- Operational and Degraded performance count as up.
- Partial outage and Major outage count as down.
- Under maintenance counts as neither, so maintenance is never an outage.
- A long gap, for example a scheduler that stood still, is credited for at most two minutes. Pharos does not fill in hours it did not see.
- History starts with the update to 1.0. Earlier days stay grey.
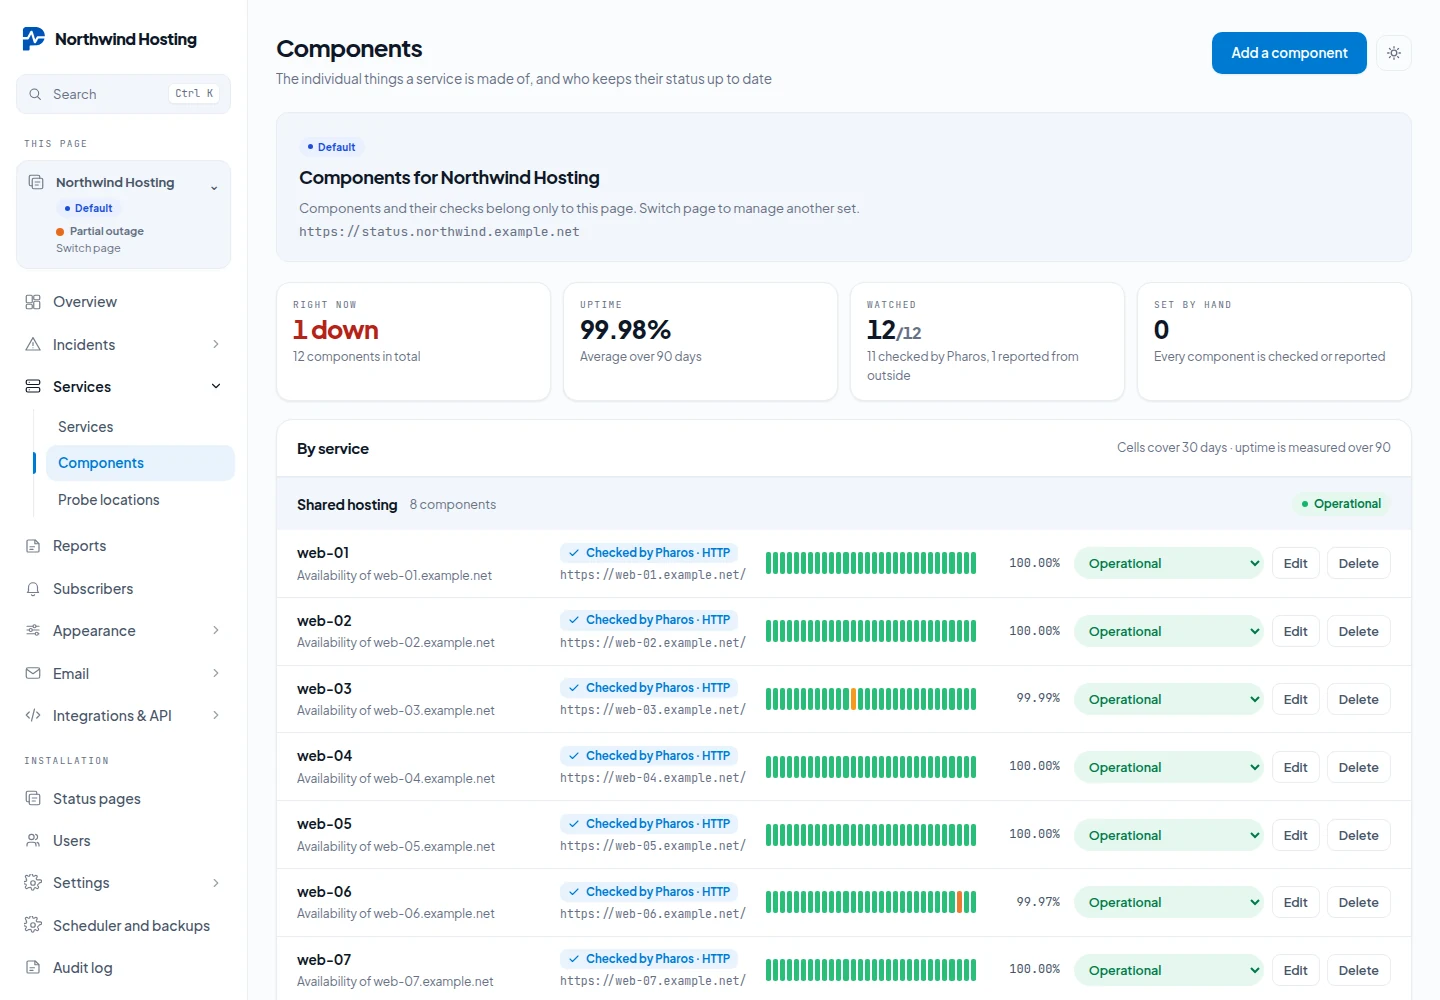
Reported uptime is only as good as the reports. If the tool that feeds a service stops sending, the service keeps its last status and keeps being counted in it. The Components screen shows via and the name of the API token that last reported, to people who may edit the page. Its Watched tile adds up what Pharos checks itself and what is reported from outside, and the Set by hand tile counts the rest.
Checks do not count time inside a maintenance window that has started for that component: those seconds are left out, they are neither up nor down. Days recorded before 1.0 are not recalculated.
| Day | Cell |
|---|---|
| 99.99% or better | green |
| 99.0% or better | amber |
| 95.0% or better | orange |
| below 95% | red |
| no data | grey |
Grey means no data, not fine. A component created yesterday shows 89 grey cells, which is the honest answer. The percentage averages only the days actually measured: counting unmeasured days as 100% would invent uptime, and counting them as 0% would punish you for installing recently.
The raw result of every check run is kept for 40 days and pruned once a day, in small
batches. The newest result of every component always stays, so a paused check keeps its last
run. Uptime figures and the 90-day bar come from the daily rows and do not change when raw
results go. Set PHAROS_CHECK_RESULT_DAYS in .env to keep
them longer or shorter. An existing SQLite file does not shrink after the first pruning: it
stops growing, and the freed space is reused.